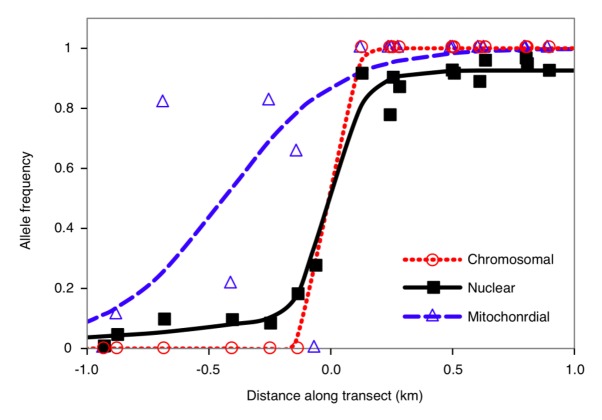
Figure 2.
Estimated allele frequency clines of chromosomal (dotted red line), nuclear (solid black line) and mitochondrial markers (dashed blue line) across a hybrid zone between P24(XY) (to the left side) and viatica17 (to the right side) on Kangaroo Island based on maximum likelihood models. Best fit models are the sigmoid model for the chromosomal and mitochondrial markers and asymmetrical stepped model for the nuclear markers. Circles, squares, and triangles represent observed allele frequencies of chromosomal, nuclear (average of 10 autosomal loci), and mitochondrial markers, respectively. Distance is expressed relative to the center (= 0 km) of the average nuclear cline.

