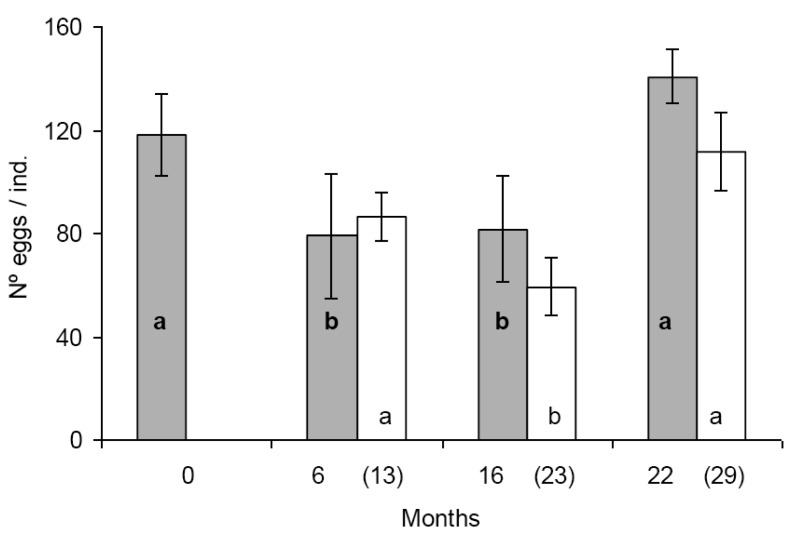
Figure 1.
Average number of eggs per individuals (± SD) in F. candida populations fed continuously on Bt-maize for various numbers of months. Grey bars represent initial exposure (first set of experiments). White bars represent repeated exposure (second set of experiments). Different lower case letters in the same row indicate significant differences at p < 0.05. Bold lower case letters refers to grey bars, others to white ones. Number of months at the initial and repeated (in parenthesis) exposure are indicated on the x-axis.

