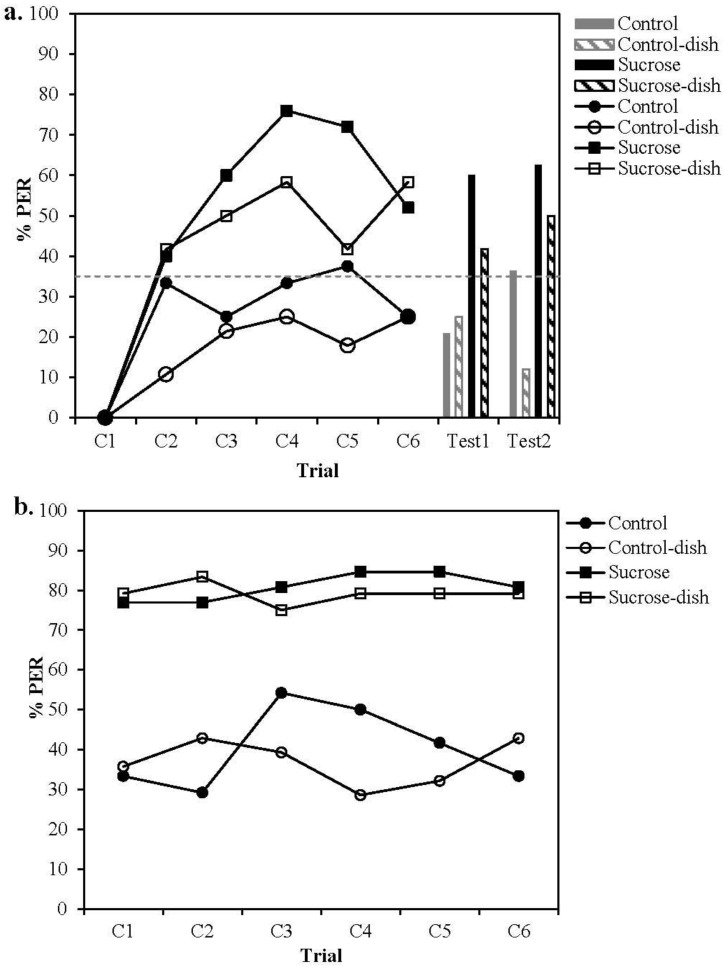
Figure 2.
Proportion of bees responding to the CS (a) or US (b) on each trial. The US was either 30% sucrose solution (Squares) or a clean sponge (Circles). Bees were either exposed to an open dish of pollen during conditioning (Open shapes, n = 53) or a closed dish (Black shapes, n = 48). Bars represent the number of bees responding to the CS in the unrewarded tests. (Black bars=Sucrose, Grey bars=Control, Striped=Exposed to pollen; Striped= Non-exposed). In Test 1 olfactory conditions were matched to those experienced during training and in Test 2 the pollen dish was covered for all bees. The dashed line represents the overall spontaneous response to the CS on the first trial for all bees tested. Asterisks denote significant differences between treatment groups (** p < 0.001 * p < 0.05).

