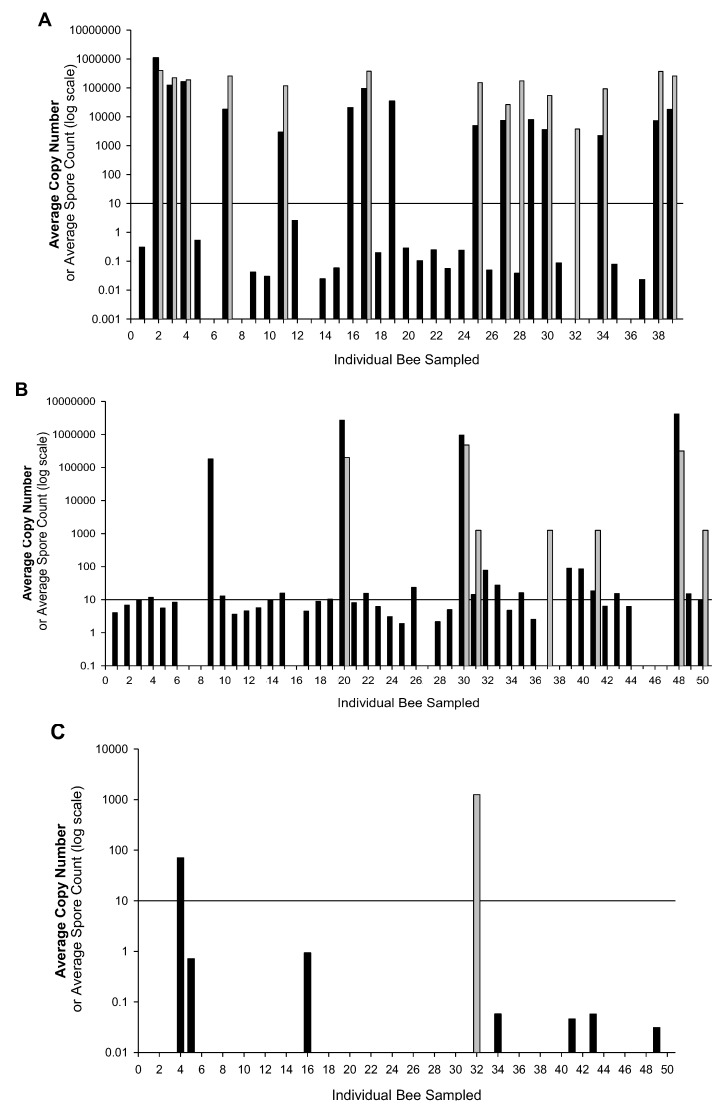
Figure 1.
Variation in the mean number of N. ceranae DNA copies (in a standardized 50 ng sample/bee) and spore counts for the same individual bees. The line represents a cut-off point, 10 copies, at which we can reliably detect N. ceranae levels. Black bars represent the mean N. ceranae DNA copies from each bee sample while the gray bars represent the mean spore counts for the same bee. (a) Data from colony 3 in the spring (b) Data from colony 1 in the summer (c) Data from colony 3 in the fall.

