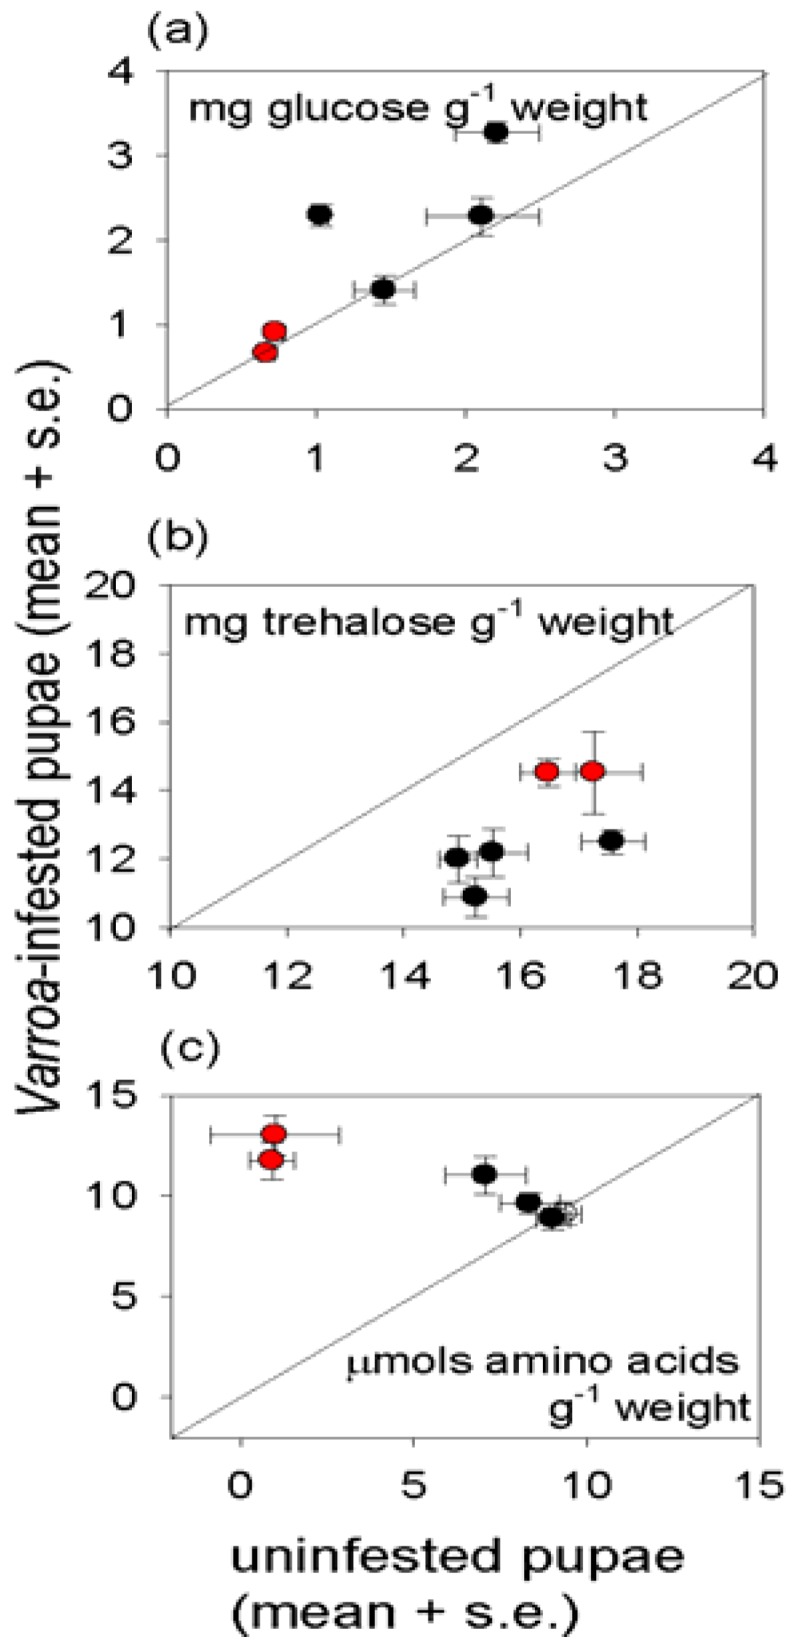
Figure 4.

Free metabolites in uninfested and Varroa-infestedhoney bees (mean ± s.e, 12 replicates), with the diagonal line of equivalence. Data for colonies with Varroa above the threshold for intervention are shown in red, and colonies below the threshold in black. The statistical analysis is shown in Supplementary Table S2.
