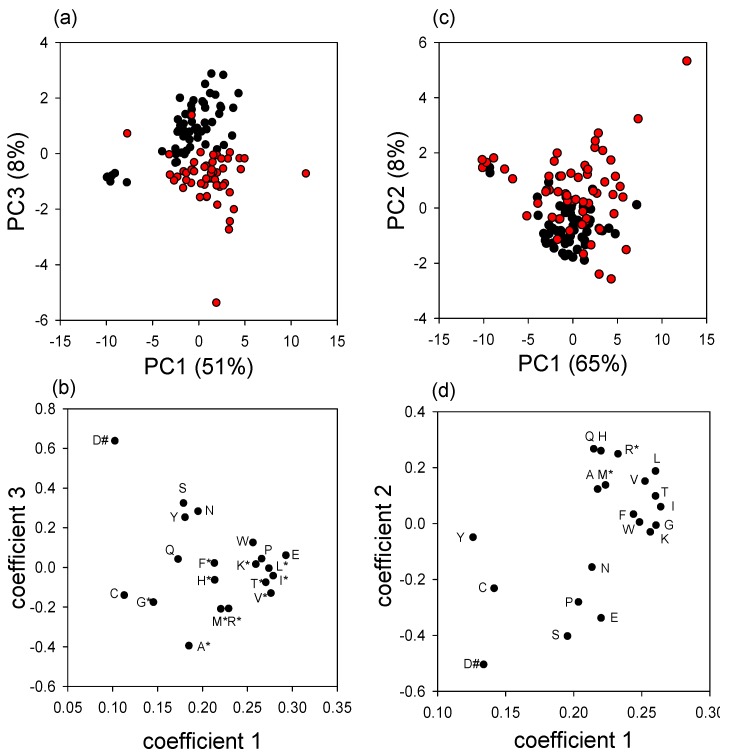
Figure 5.
Principal components analysis of the free amino acid content of the honey bees (with open symbols uninfested and closed symbols Varroa-infested insects). Data for colonies with Varroa above the threshold for intervention are shown in red, and colonies below the threshold in black. (a) principal components 1 and 3 of pupae; (b) coefficients for pupae; (c) principal components 1 and 2 of newly-emerged bees; (d) coefficients for newly-emerged bees [#significantly elevated in uninfested insects; * significantly elevated in Varroa-infested insects].

