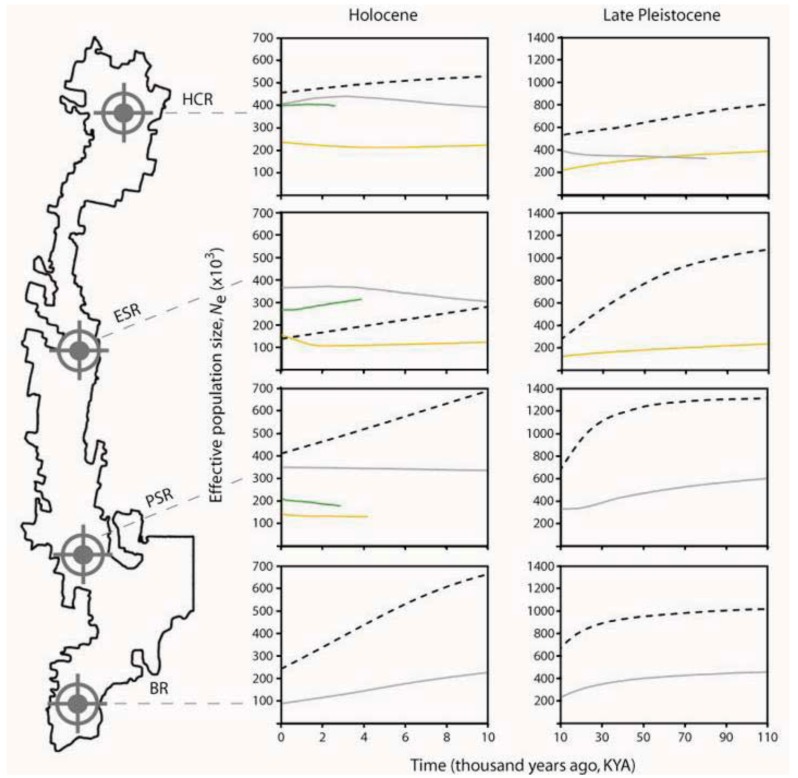
Figure 5.
Bayesian Skyline plots showing changes in effective population size (Ne), estimated from mtDNA sequences of co-distributed springtails and flatworms. Genetic population abbreviations follow Figure 3. Curves represent the median Ne-value (y-axis) plotted over time (x-axis). Curve colours approximate colours of the species themselves (see Figure 2) and are as follows: Pseudachorutinae sp., pale gray; Acanthanura sp., black (dashed); Artioposthia lucasi, yellow; and Caenoplana coerulea, dark green (A. lucasi population PSR corresponds with PSR-1 in Figure 3). Note that for a given population, Holocene vs. Late Pleistocene represents the same analysis (rescaled). Associated confidence intervals are provided in online Supplementary Material (Figure S1). Some demographic reconstructions show very limited temporal depth given that there were few haplotypes (Nhap) and the mtDNA sequence divergence among them was low (see Table 1). Bayesian Skyline plots could not be estimated for the two flatworm species’ Badja Region populations because there was no genetic variation. Analysis methods are described in online Supplementary Material.

