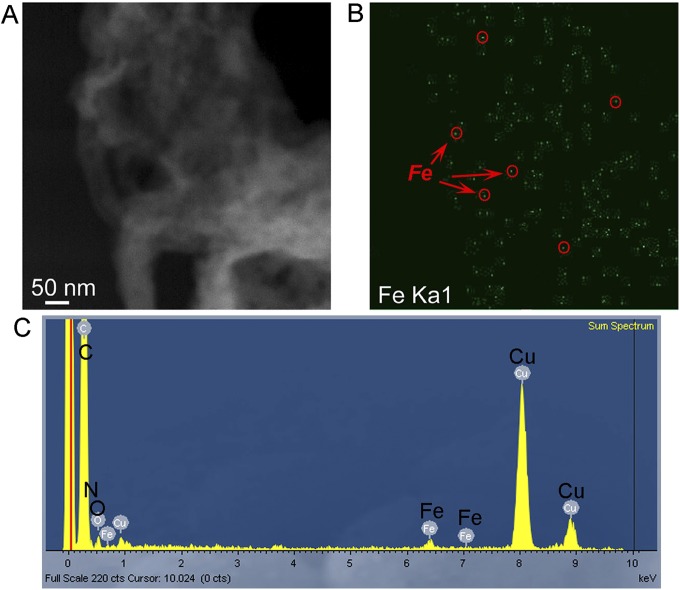
Fig. S10.
Iron distribution inside Fe/N/CF fiber. (A) STEM image of a section of Fe/N/CF fiber showing no iron particle agglomeration. (B) Mapping of Fe element distribution on the Fe/N/CF section shows iron intensity is proportional to the fiber thickness of catalyst, suggesting that Fe is uniformly and possibly atomically dispersed inside the fiber. (C) A representative EDX spectrum of the Fe/N/CF. The Fe signal could be detected ubiquitously on the fibrous catalyst.

