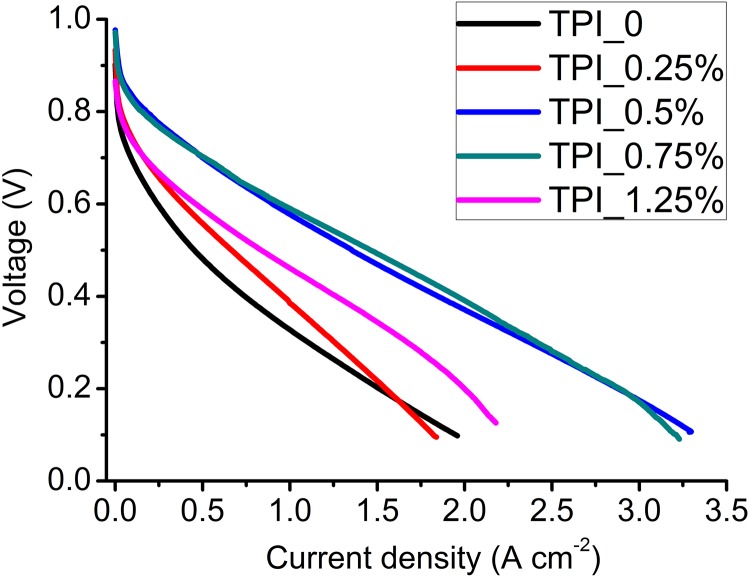
Fig. S18.
Polarization curves of Fe/N/CF catalysts prepared with different TPI salt concentrations in the precursor solution. Catalyst loadings were 2 mg⋅cm−2 for all cells. I/C = 1/1. The concentrations of TPI in the precursors are indicated in the figure. Membrane: N211; O2/H2 pressures: 2 bars; 100% RH; cell temperature: 80 °C.

