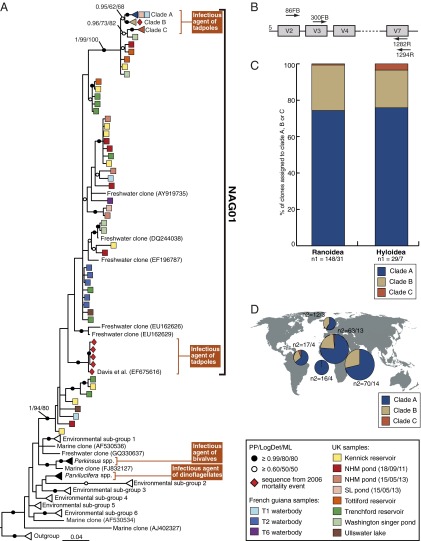
Fig. 1.
(A) Phylogenetic tree of Perkinsea SSU rDNA sequences focusing on the NAG01 group that includes two separate phylogenetic groups recovered from tadpole liver tissue samples. The phylogeny is estimated from a masked alignment consisting of 292 taxa and 776 characters. Bayesian posterior probability (6,000 samples from 2,000,000 MCMCMC generations), LogDet distance bootstrap (1,000 pseudoreplicates), and maximum likelihood bootstrap (1,000 pseudoreplicates) values are added to each node using the following convention: support values are summarized by black circles when all are equal to or greater than 0.9/80%/80%, and white circles when the topology support is less but equal to or greater than 0.6/50%/50%. Five sequences of Amoebophrya sp. were used as outgroup. Each square represents one environmental operational taxonomic unit (OTU), and the provenance of the OTUs is indicated by colored boxes (see key for the detail of sample provenance) (SI Appendix, Table S2 provides more details on the environments sampled). A red diamond indicates the individual clone sequences from the L. sphenocephalus 2006 mass mortality event in Georgia (United States) (12). A subset of the published environmental sequences have been reduced to representative triangles (see SI Appendix, Table S10 for detail of each environmental clade). (B) Representation of the V4 hyper-variable region of the template SSU rDNA and the relative position of the different primers used in this study (not to scale). (C) Histogram representing the percentage of clones per clade A, B, and C within each host superfamily from infected tadpoles. n1 represents the number of total clones sequenced per host superfamily/number of infected tadpoles per host superfamily. (D) Geographical distribution of clade A, B, and C. Pie charts represent the proportion of clones per clade A, B, and C in each of the five geographical locations where NAG01 was detected (United Kingdom, French Guiana, São Tomé, Cameroon, and Tanzania). n2 represents the number of clones sequenced per geographical location/number of infected tadpoles per geographical location.

