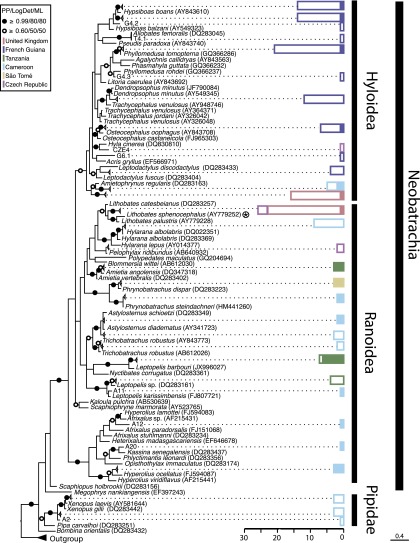
Fig. 3.
Bayesian 16S rDNA phylogenetic tree of tadpole diversity sampled in this study, with histograms showing prevalence of NAG01 detection. The phylogeny is inferred from a masked alignment consisting of 247 taxa and 440 characters. Bayesian posterior probability (6,000 samples from 2,000,000 MCMCMC generations), LogDet distance bootstrap (1,000 replicates), and maximum likelihood bootstrap (1,000 replicates). Support values are summarized by black circles when all are equal to or greater than 0.9/80%/80%, and a white circle when topology support is weaker but all values are equal to or greater than 0.6/50%/50%. Sequences of Ambystoma sp. and Pleurodeles sp. (salamanders) were used as outgroup. Some frog species with multiple nonidentical 16S rDNA sequences recorded in GenBank are retained. The color-coded histogram represents the number of NAG01-negative tadpole samples (uncolored bars) and the number of NAG01-positive samples (colored bars). Each color corresponds to the tadpole’s country of origin as detailed in the key. The superfamily and suborder of the tadpoles tested is indicated on the histogram. The circled star indicates the host species described by Davis et al. (12) during the 2006 mortality event.

