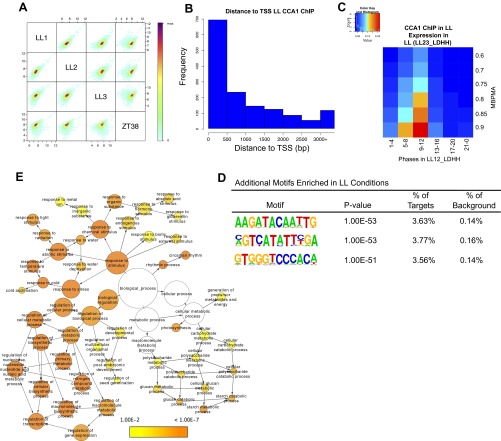
Fig. S1.
(A) Correlation of sequence tags between each of three CCA1 ChIP-Seq experiments performed at ZT26 in LL and one ChIP-Seq experiment performed at ZT38 in LL. R2 values of correlation between the three ZT26 replicates are LL1–LL2, 0.93; LL2–LL3, 0.77; and LL1–LL3, 0.82. (B) Histogram showing distances between the identified peaks of CCA1 occupancy in LL and the TSS of the nearest gene (bin size = 0–500 bp; range, 0–3,000 bp). (C) Phase enrichment of cycling CCA1-occupied targets. The expression datasets include transcripts that display >0.5 MBPMA in LL (LL23_LDHH). Genes were grouped by phase and MBPMA score (strength of cycling) into 36 groups. The ratio of CCA1 occupancy to the number of genes in each group is indicated by the intensity of the heat map (red and blue colors indicate maximum and minimum ratios of putative targets in the bin). (D) Additional motifs enriched in CCA1-occupied targets in LL. (E) Functional enrichment analysis with full GO biological process category of the 1,100 CCA1 targets identified in LL with a peak within 1 kb of the TSS. Circle size is proportional to gene numbers, and the color of each circle represents the enrichment P value for the GO term label on that circle, with orange representing highest enrichment and yellow the lowest enrichment above the cutoff (FDR corrected 0.01). Distance between nodes was arranged manually to optimize readability. The graph was generated using BINGO software (63).

