
Fig. S4.
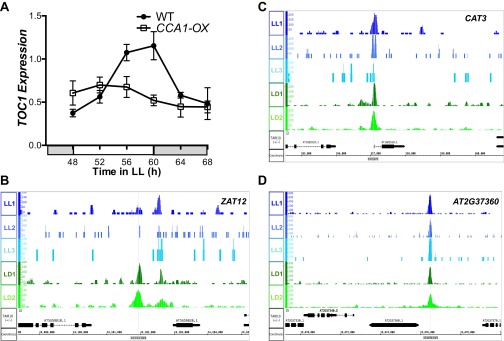
(A) qRT-PCR of TOC1 transcript levels in wild-type (Col-0) and CCA1-OX plants grown in LL after 10 d entrainment in 12-h:12-h LD cycles. mRNA levels were normalized to IPP2 and PP2A expression (mean values ± SD, n = 2, two independent experiments). (B–D) Normalized tag counts by location in the genome for CCA1 targets ZAT12 (AT5G59820) (B), CAT3 (AT1G20620) (C), and AT2G37360 (D) for each of the three replicate LL ChIP experiments (blue) and for each of the two replicate LD ChIP experiments (green). Genome annotation for the respective gene structures is shown below.