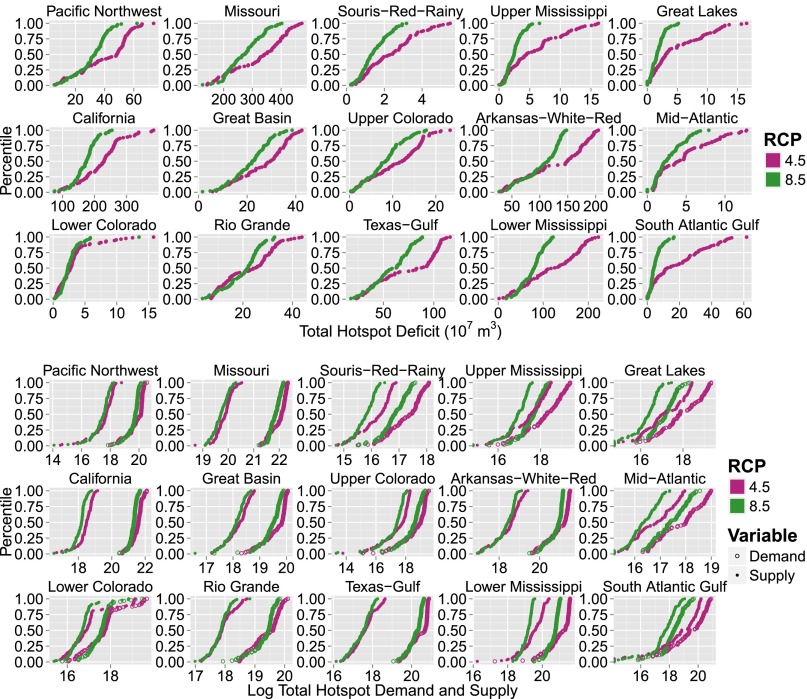
Fig. 3.
Empirical cumulative density function (CDF) of total regional hotspot deficit (106 m3) (top three rows) and total regional demand (solid circles) and supply (empty circles) (106 m3/y) to areas categorized as deficit hotspots (bottom three rows) during the month of August for RCP 4.5 (maroon) and RCP 8.5 (green) over the period 2005–2095.

