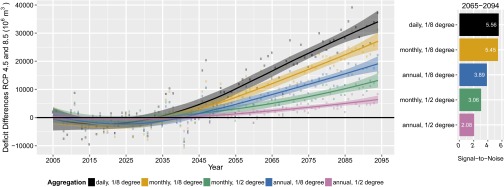
Fig. 5.

(Left) The difference in total annual water deficit between the two RCP scenarios (RCP4.5 minus RCP8.5) using multiple methods of aggregations both spatially and temporally; shaded areas represent the 95% confidence band on the mean trend. (Right) A comparison of signal-to-noise ratios across the five aggregation methods and the future time period of 2065–2094.
