Fig. S1.
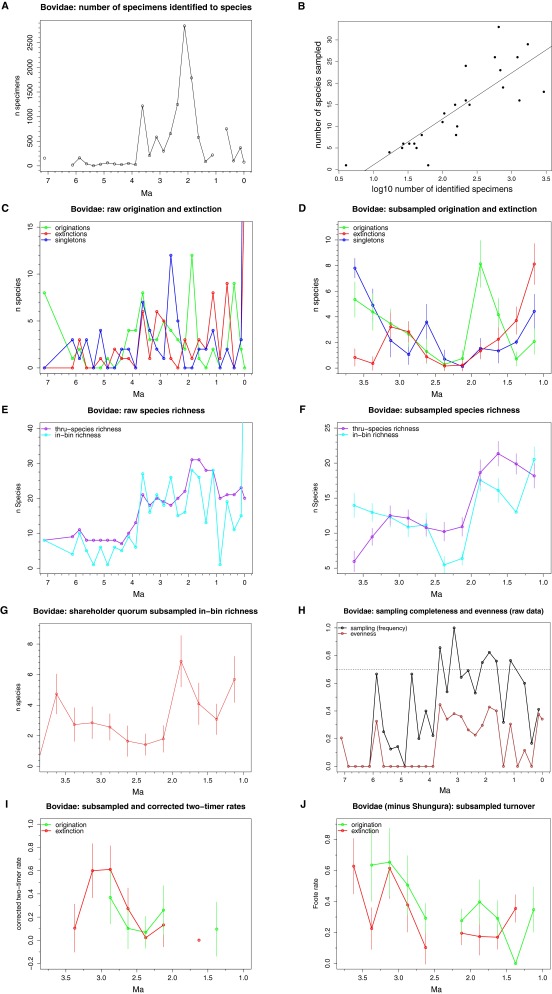
Eastern African bovid dataset. (A) Number of specimens identified to species by time bin. (B) Relationship between number of specimens and in-bin species richness in the raw data (R2 = 0.68). (C) Raw and (D) subsampled origination, extinction, and singleton values. Note the large singleton peaks at 3.75–3.5 Ma and 2.75–2.5 Ma, a main sources of Vrba’s (29) bovid origination pulses. (E) Raw species richness based on sampled-in-bin and range-through counting methods. (F) Subsampled mean (±SD) species richness. (G) In-bin mean (±SD) species richness subsampled using the shareholder quorum method. (H) Sampling completeness and evenness in the raw data. At an arbitrary 70% cutoff (dashed line), only the 3.75–1.5 Ma series approaches sufficient sampling quality for analysis. (I) Subsampled and corrected two-timer rates. (J) Subsampled Foote origination and extinction rates calculated with the Shungura Formation excluded. Note significant attenuation of the 2.0–1.75 Ma origination peak.

