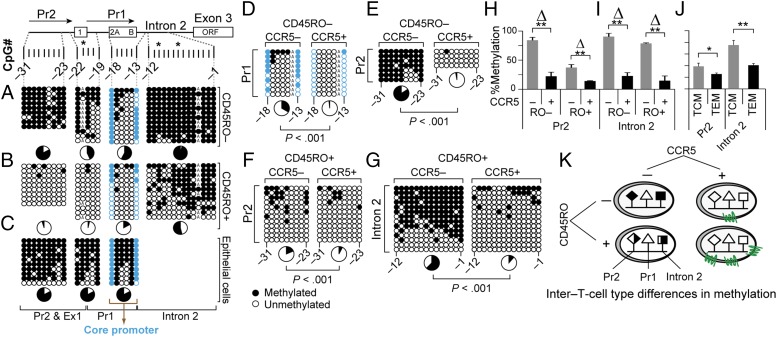
Fig. 2.
Distribution of DNA methylation content in CCR5-Pr2, -Pr1, and -intron 2 in T-cell subsets. (A–G) Methylation content of the indicated CpGs derived by bisulfite genomic sequencing (BGS) in (A) CD3+CD4+CD45RO− T cells; (B) CD3+CD4+CD45RO+ T cells; (C) oral epithelial cells; and (D–G) CCR5− or CCR5+ CD3+CD45RO− and CD3+CD45RO+ T cells. Each column represents the CpG site interrogated, and each row represents a single clone. Closed and open circles represent methylated and unmethylated CpG sites, respectively. The asterisks indicate a haplotype-specific polymorphism; CpG −4 is disrupted in one allele due to a private polymorphism in the donor shown in A and B. Pie charts, % methylation; CpGs −18 and −13 (blue) encompass a core of constitutively demethylated CpGs within CCR5-Pr1 in T cells. (H–J) Methylation content assessed by pyrosequencing of four representative CpGs located within (H) CCR5-Pr2 (CpG −31 to −28) and (I) intron 2 (CpG −5 to −2) in cell-sorted CCR5+ and CCR5− CD3+ T cells and (J) central memory (TCM; CD45RA−CD45RO+CCR7+) and effector memory (TEM; CD45RA−CD45RO+CCR7−) T cells. The pyrosequencing data are depicted as mean percentage methylation and error bars depict the standard error of the mean (SEM). Data are from three donors. **P < 0.01 and *P < 0.05, small vs. larger Δ, relative difference in methylation content. (K) Schema depicting the relative methylation content of CCR5-Pr2 and CCR5-intron 2 in cell-sorted CCR5-positive and CCR5-negative CD45RO+ and CD45RO− T cells, supporting criterion 1.

