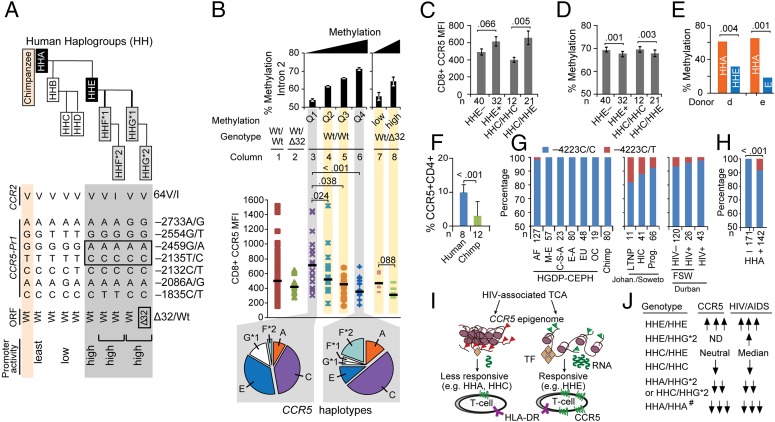
Fig. 7.
Associations among HIV/AIDS-modifying polymorphisms in CCR5 with increased vs. decreased sensitivity of CCR5 cis-regions to undergoing HIV- or activation-associated demethylation. (A) Polymorphisms in the coding regions of CCR5 [wild type (Wt) vs. Δ32] and CCR2 (V64I) and the CCR5 promoter were categorized into CCR5 human haplogroups (HH) A–G*2 using an evolutionarily based strategy (6). HHF*2 and HHG*2 represent the CCR2-64I– and CCR5-Δ32–containing haplotypes, respectively. Relative haplotype-specific promoter activity assessed by transcriptional reporter assays is indicated (Bottom) (8). (B) Association between DNA methylation (assessed by pyrosequencing of representative CpGs in CCR5-intron 2) and CCR5 levels on CD8+ T cells in 85 HIV+ individuals with stably suppressed viral load (from the SCOPE cohort). Before accounting for methylation content, CCR5 levels (MFI; ordinate) were assessed in subjects dichotomized as those lacking CCR5-Δ32 (Wt/Wt; n = 72) vs. those possessing a CCR5-Δ32 allele (Wt/Δ32; n = 13). Wt/Δ32 persons had a haploid range of CCR5 expression compared with Wt/Wt subjects (columns 1 and 2, respectively). CCR5 levels in Wt/Wt individuals were derived according to the quartiles of the average percent methylation of the representative CpGs in intron 2 (Top; columns 3–6). CCR5 levels in persons with the Wt/Δ32 genotype were dichotomized according to the median of the overall methylation content in intron 2 in these individuals (columns 7 and 8; low vs. high). Horizontal black lines indicate the median values of CCR5 MFI in each group. Pie charts show the frequency of the CCR5 haplotypes in individuals with Wt/Wt genotype whose methylation content in CCR5-intron 2 classified to the least (column 3) and most (column 6) methylated quartiles (Left and Right pie charts, respectively). P values are shown for the differences in CCR5 surface expression according to quartiles of intron 2 methylation in Wt/Wt subjects (with Q1 as the reference) and high vs. low methylation in CCR5-Δ32 heterozygotes. The error bars represent SEM. (C and D) Mean CCR5 expression (C) and mean percentage methylation level of representative CpGs in CCR5-intron 2 (D) in the same individuals (n = 72), categorized by whether they possessed (+) or lacked (−) at least one CCR5-HHE haplotype and whether they possessed the HHC/HHC vs. HHC/HHE genotypes. The error bars represent SEM. (E) In two healthy donors with the CCR5-HHA/HHE genotype, HHA-specific and HHE-specific methylation content was determined by bisulfite genomic sequencing after in vitro TCR stimulation (120 h) with anti-CD3/CD28 Abs. The rs2227010 polymorphism was used to discriminate HHA- vs. HHE-derived clones. (F) Percentage of CD4+ T cells expressing CCR5 in chimpanzee and HIV− humans. The error bars represent SEM. (G) Genotype frequency of CCR5 −4223C/T (rs553615728) in (i) the Human Genome Diversity Project (HGDP)-Centre d'Étude du Polymorphisme Humain (CEPH) populations (AF, Africa; C-S-A, Central South Asia; E-A, East Asia; EU, Europeans; M-E, Middle East; OC, Pacific Ocean) and 80 chimpanzee samples previously studied (44) (Left); (ii) black South Africans from Johannesburg/Soweto (Johan./Soweto) categorized as long-term nonprogressors (LTNP), HIV controllers (HIC), and progressors (Prog.), as defined in SI Appendix, Materials and Methods (Middle); and (iii) black female sex workers (FSW) from Durban, KwaZulu-Natal (CAPRISA cohort), South Africa categorized as those who remained HIV-seronegative (≥2 y follow-up; HIV−) vs. those who acquired HIV during follow-up (HIV+) and a separate cohort of women from the same region who were recruited during primary HIV infection (Right). The differences in genotype frequency should be compared separately in the study groups from the Johannesburg/Soweto and Durban sites, because geographic differences in SNP frequency may exist between these two sites. (H) Linkage disequilibrium of −4223T with CCR5-HHA. Data are from persons of African descent shown in G. (I) Model supporting criterion 4. TF, transcription factor. Red and green triangles represent histone marks. (J) Previously described associations of CCR5 haplotype pairs with CCR5 expression and HIV/AIDS susceptibility. #, inferred from chimpanzee. P values are shown for the compared groups in C–F and H.

