Fig. 1.
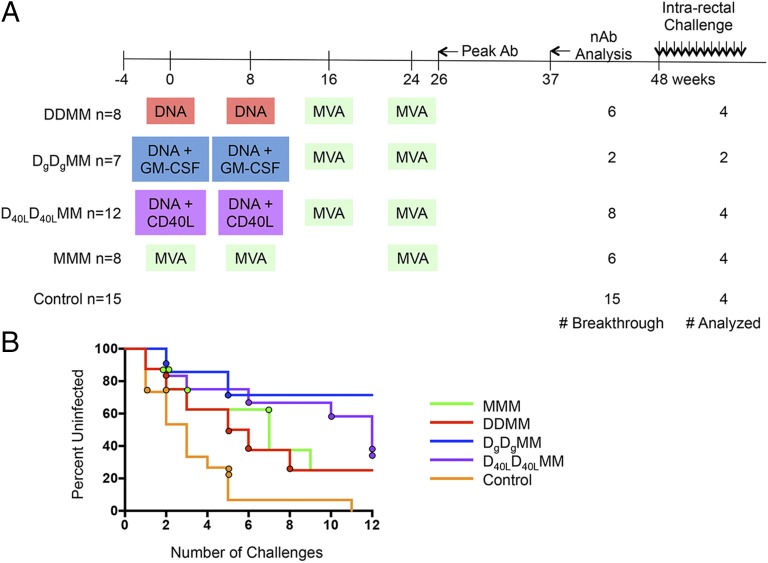
Timeline of the M11 and M12 NHP vaccine trials. (A) The immunization schedule for the M11 and M12 vaccine trials is plotted along a timeline in weeks. M11 consisted of DDMM, DgDgMM, and MMM vaccine groups, whereas the M12 trial added on the D40LD40LMM group. The agents used for priming and boosting are indicated in colored boxes, highlighting similarities and differences between vaccine groups. The total number of animals in each immunization group and the control group is shown to the left. The number of breakthrough infections and number of animals analyzed for each group is shown to the right. The time point at which the peak levels of antibody binding to SIVsmE660- and SIVmac239-derived gp140 proteins were observed is indicated by an arrow as “Peak Ab.” The time point that was analyzed for nAb activity (shown in Fig. 3B and Fig. S6) is indicated by an arrow and “nAb Analysis.” Weekly intrarectal challenges with SIVsmE660 were initiated at week 48. (B) A survival curve is shown for each of the vaccine groups, which are indicated by color in the key. The circles indicate the challenge that resulted in infection of each monkey that was included in the nAb study. For example, one control monkey (orange circles) was infected at challenge 1, one at challenge 2, and two at challenge 5.

