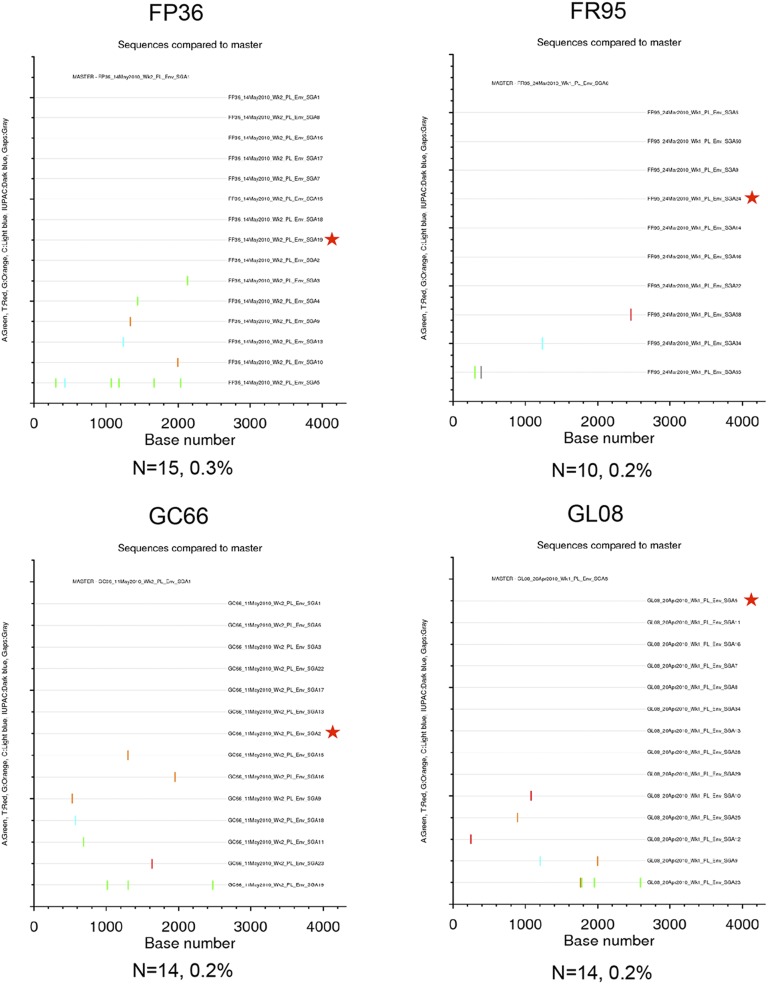
Fig. S2.
Highlighter plots of SGA env sequences derived from D40LD40LMM-immunized RMs. Each highlighter plot was generated using SGA-derived complete env nucleotide sequences, which are ∼2,700 nts in length. Aligned sequences from each dataset were exported from Geneious in the fasta format and uploaded to www.hiv.lanl.gov/content/sequence/HIGHLIGHT/highlighter_top.html. Colored ticks indicate mismatches from the master sequence indicated (A, green; T, red; G, orange; C, light blue; IUPAC, dark blue; gaps, gray). A red star indicates the env amplicon that was cloned and used in the neutralization assays. The number of sequences and maximum pairwise distance are shown beneath each plot.

