Fig. 5.
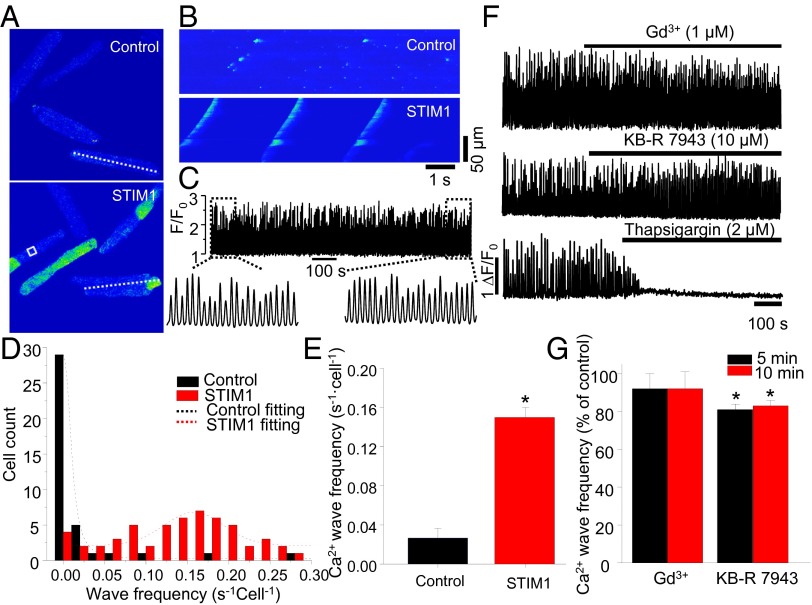
The change of SR Ca2+ leak and STIM1 overexpression. (A) XY time-series images of [Ca2+]i (fluo 4) in control (Upper) and STIM1 (Lower) overexpressing myocytes. (B) Line scan images of fluo 4 in control and STIM1 overexpressing myocytes (lines are shown in A). (C) An example of Ca2+ wave profile (white box in A) in STIM1 overexpressing myocytes. (D) Histogram shows the cell count and Ca2+ wave frequency in control and STIM1 overexpressing myocytes. (E) Summary data show the change of Ca2+ wave frequency in STIM1 overexpressing myocytes (n = 40 and 58 cells in control and STIM1, respectively). (F) Representative Ca2+ wave profiles show the effect of GdCl3 (1 μM), KB-R 7943 (10 μM), and Tg (2 μM). (G) Summary data show the effect of GdCl3 and KB-R 7943 on spontaneous Ca2+ wave frequency in STIM1 overexpressing myocytes (n = 7 and 5 cells in the Gd3+ and KB-R groups, respectively). *P < 0.05 vs. control.

