
Fig. 3.
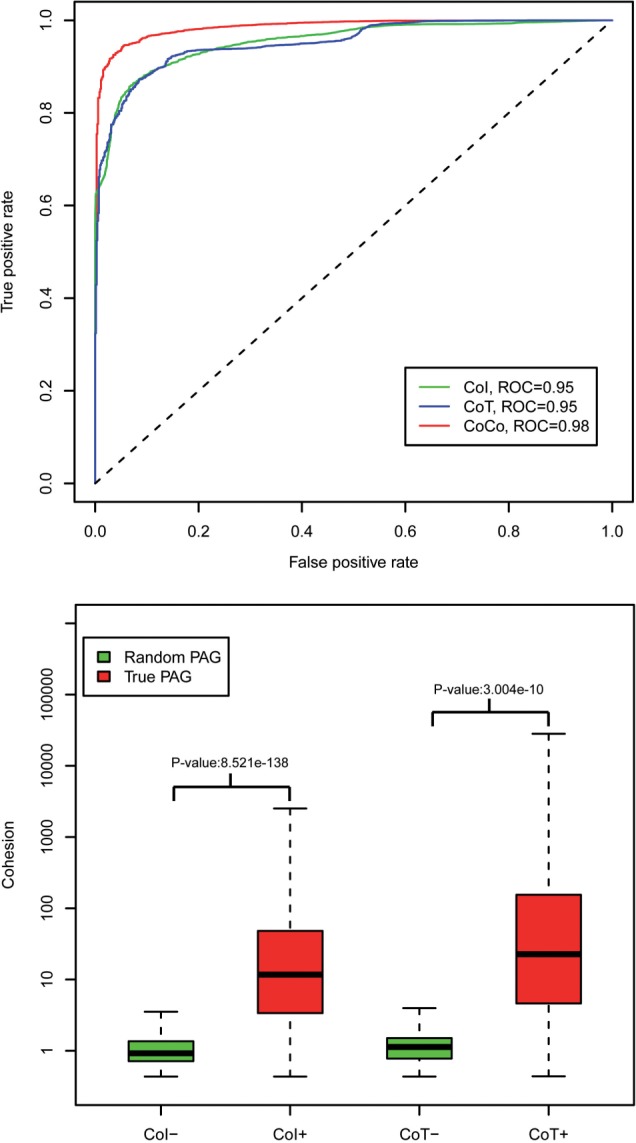
Cohesions (CoI, CoT and CoCo) performance: (a) ROC curves, (b) comparison boxplot. CoI+, CoI in the true PAGs; CoI−, CoI in the random PAGs; CoT+, CoT in the true PAGs; CoT−, CoT in the random PAGs
Official websites use .gov
A
.gov website belongs to an official
government organization in the United States.
Secure .gov websites use HTTPS
A lock (
) or https:// means you've safely
connected to the .gov website. Share sensitive
information only on official, secure websites.
Cohesions (CoI, CoT and CoCo) performance: (a) ROC curves, (b) comparison boxplot. CoI+, CoI in the true PAGs; CoI−, CoI in the random PAGs; CoT+, CoT in the true PAGs; CoT−, CoT in the random PAGs