
Fig. 16.
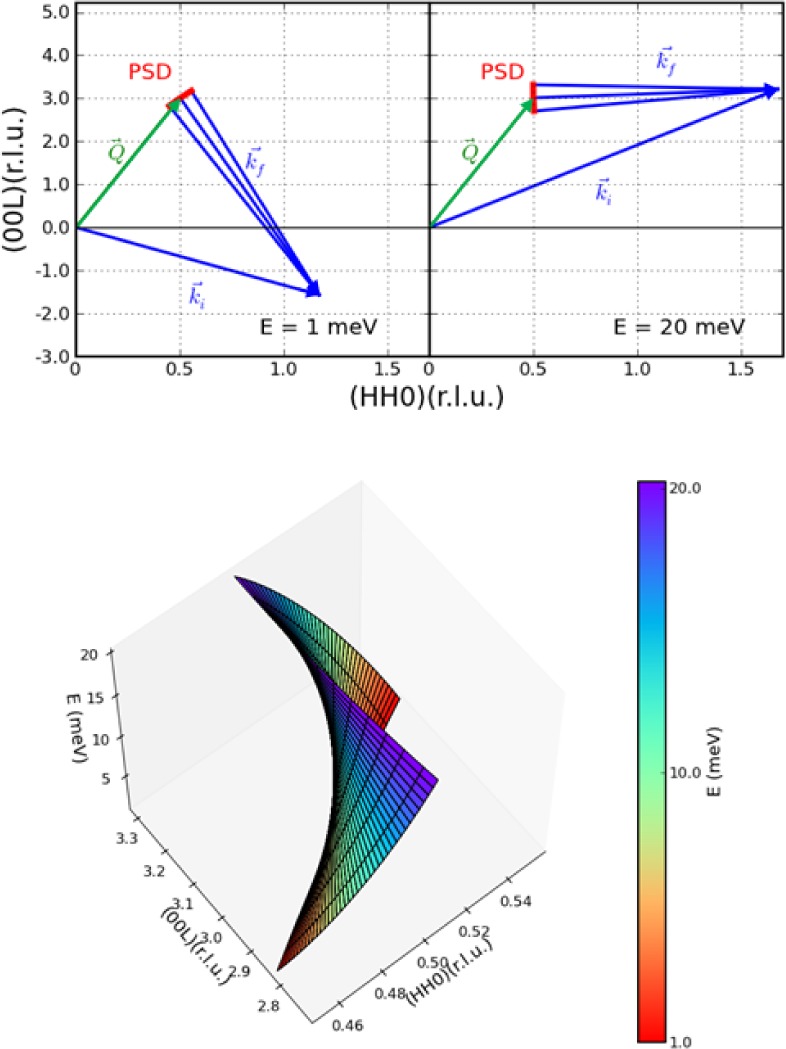
(top-left). The scattering diagram for this iron-superconductor crystal for an energy transfer of 1 meV, drawn to scale. The wave vector range sampled by the PSD at this setting of the spectrometer (red) is more along the [H,H,0] direction at low energies. At an energy transfer of 20 meV (top right) we see that the wave vector range sampled has rotated to along the [0,0,L] direction. (bottom) Isometric plot showing the relationship between the range and direction of the wave vector obtained at each setting of the spectrometer, as a function of the energy transfer indicated by the color bar, from 1 meV (red) to 20 meV (purple).