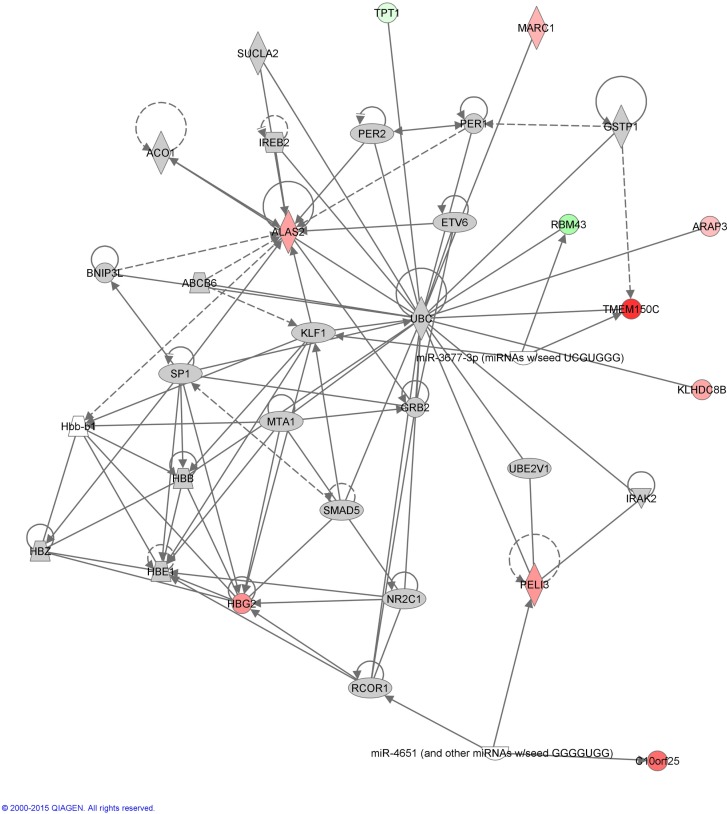
Figure 1.
Annotation enrichment analysis. A network including the gene functions “cardiovascular system development and function,” “cell morphology,” and “hematological system development and function” was significantly enriched in patients with epilepsy after initiation of treatment with valproic acid [score = –log(p-value) = 30]. Red nodes designate up-regulated genes. Numbers indicate the log2 fold change (0 is equal expression). Uncolored nodes are genes in this network that were not in our list of differentially expressed genes.

