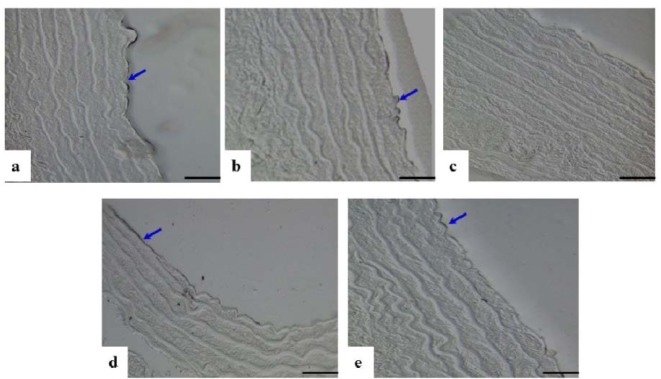
Figure 3. Photomicrograph showing cross sections of the thoracic aorta under immunohistochemical staining for eNOS expression. a(Ctrl), b(Ctrl-MC), c(DM-Ctrl), d(DM-MC), e(DM-Met). Note the increase eNOS expression in endothelial lining (stained black, blue arrows) in c(DM-Ctrl). LM X 200.

