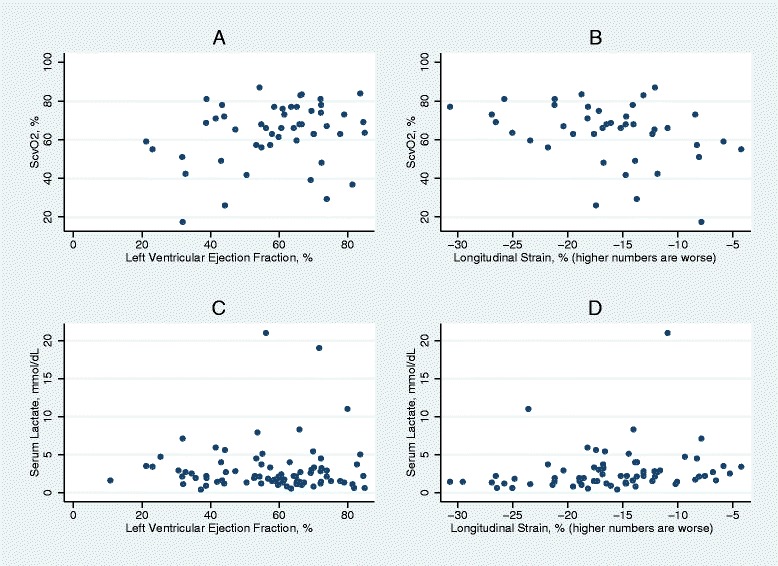
Fig. 1.

Scatterplots of (a) left ventricular ejection fraction (EF) and central venous oxygen saturation (ScvO2), (b) longitudinal strain and ScvO2, (c) EF and lactate, and (d) strain and lactate. These graphs illustrate that elevated lactate and low ScvO2 may be observed with elevated EF but are less often observed with normal strain
