Figure 1.
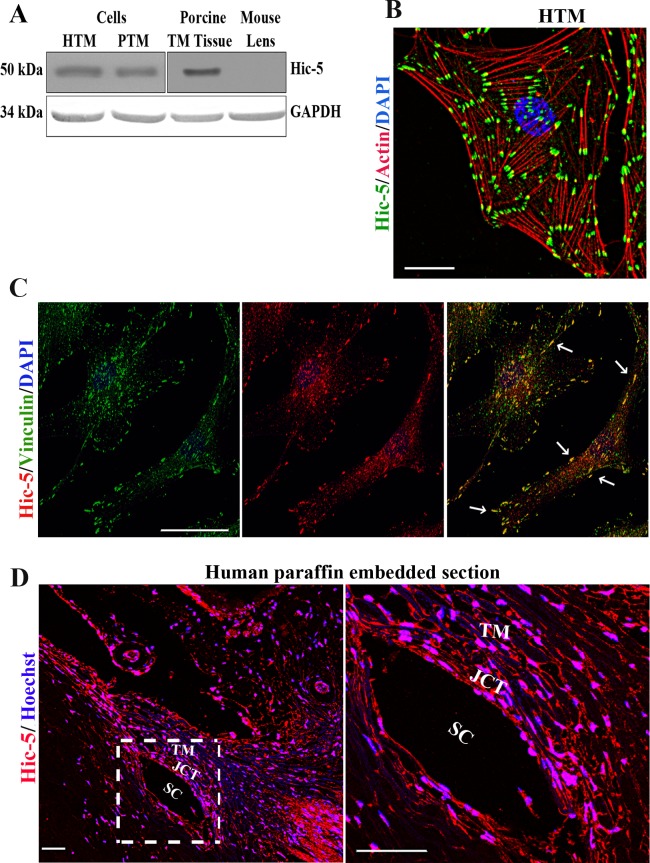
Expression and distribution of Hic-5 in human TM cells and the AH outflow pathway. (A) Immunoblotting analysis reveals Hic-5 expression in lysates of human TM cells, porcine TM cells, and porcine TM tissue. Glyceraldehyde 3-phosphate dehydrogenase (GAPDH) was used as a loading control. (B) Distribution of Hic-5 (green) and actin stress fibers (red) in HTM cells based on immunofluorescence (using Hic-5 monoclonal antibody) and rhodamine-phalloidin fluorescence, respectively. Cell nuclei are stained with 4′,6-diamidino-2-phenylindole (DAPI; blue). (C) Colocalization of Hic-5 (red) with vinculin (green) in HTM cells based on immunofluorescence analysis using polyclonal Hic-5 and monoclonal vinculin antibodies. (D) Immunofluorescence analysis of Hic-5 distribution (red) in tissues of the aqueous humor outflow pathway (including TM, JCT, and SC) of human donor specimens, using a polyclonal Hic-5 antibody. Nuclei are stained with Hoechst (blue). On the right is a magnified image of the area marked on the left. Scale bars: 50 μm.

