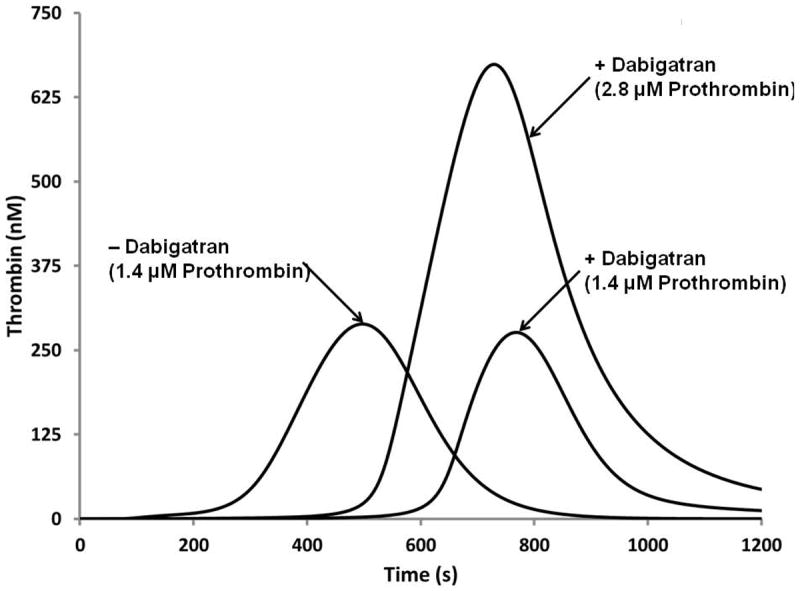
Figure 9.

Numerical simulation of the reversal of dabigatran therapy with exogenous prothrombin. Dabigatran concentration (250 nM) is the effective Cmax concentration at the pharmacokinetic 50th percentile. Three curves are illustrated; a “normal” thrombin generation curve with 1.4 μM prothrombin, the same numerical proteome mixture with Dabigatran added and the latter to which a 100% increase in prothrombin is included.
