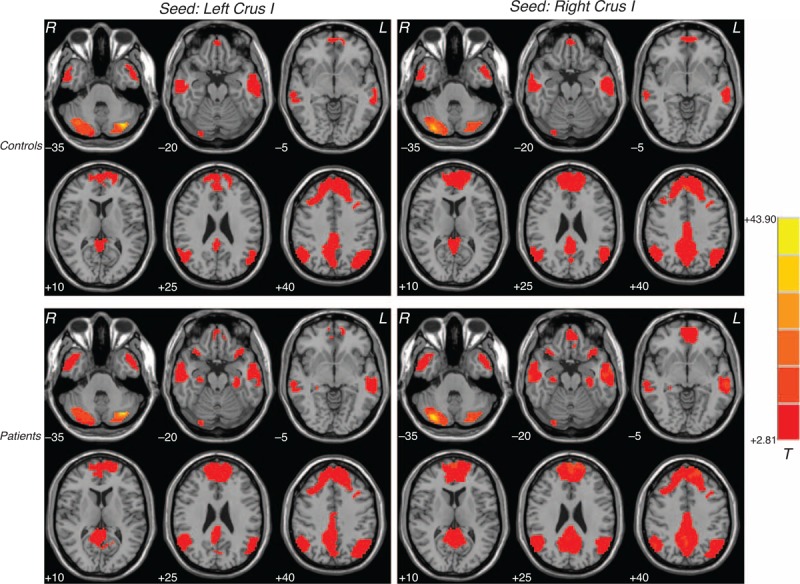
FIGURE 1.

Brain regions with resting-state cerebellar-DMN connectivity. Correlation maps for the controls and the patients with major depressive disorder are displayed in the top row and bottom row. Red denotes higher connectivity and the color bar indicates the T values from 1-sample t tests. DMN = default mode network.
