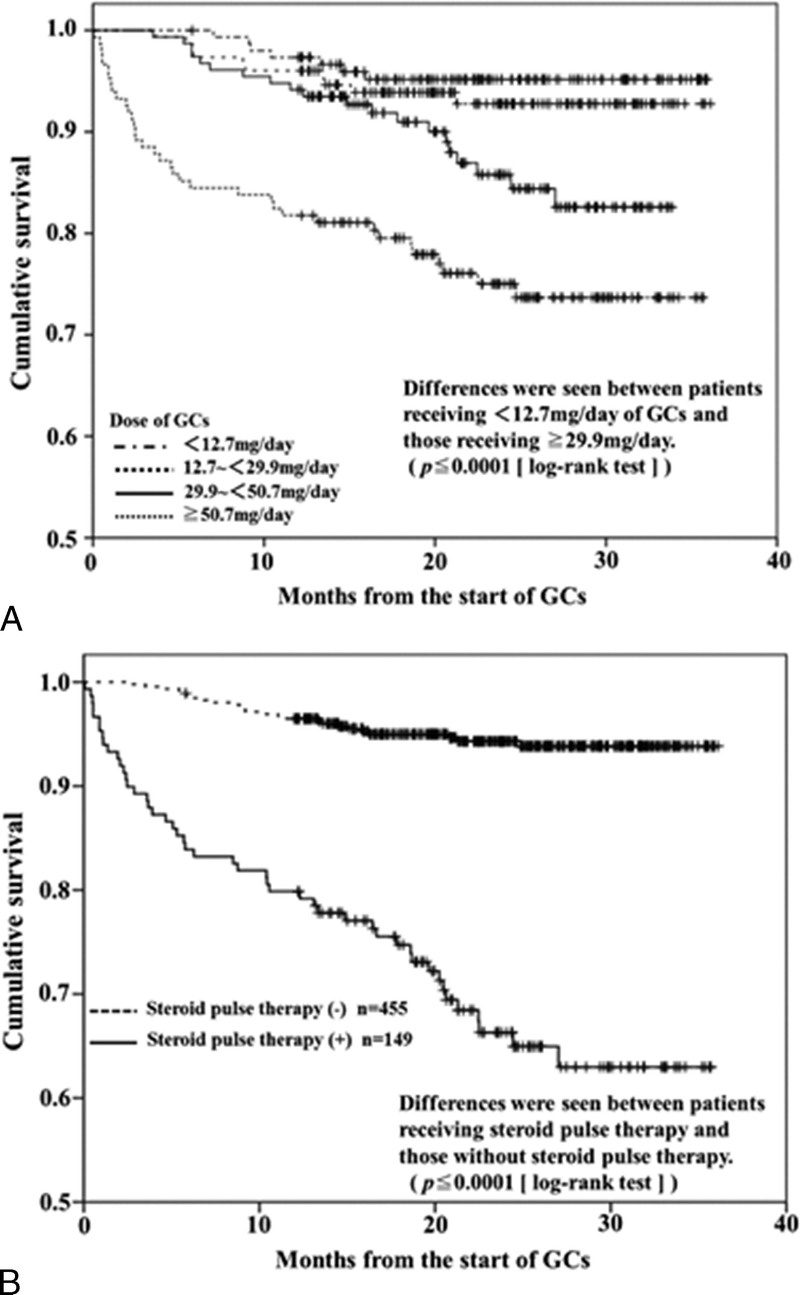
FIGURE 1.

A, Kaplan-Meier survival curves illustrating survival distribution. Curves are stratified by average prednisolone dose (ranges shown in lower left corner). Statistically significant differences were observed between patients receiving high-dose GCs (≥29.88 mg/d) and those receiving low-dose GCs (<12.7 mg/d). B, Kaplan-Meier survival curves stratified by the presence or absence of steroid pulse therapy (>500 mg/d of intravenous methylprednisolone). There was a significant difference in survival between patients receiving and those not receiving steroid pulse therapy (p < 0.0001, log-rank test).
