
FIGURE 2.
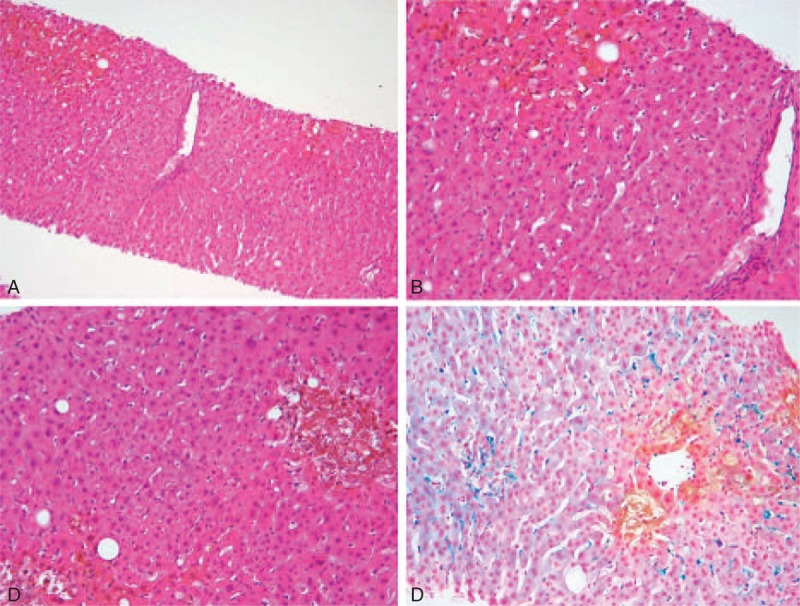
Liver histology. A and B: Portal tract (in the middle) and centrilobular cholestasis [10× (A), 20× (B) original magnification]. C and D: Mild steatosis and Kupffer cell activation with hemosiderosis are associated with zone 3 cholestasis (C: 20 × original magnification, D: Perls stain).