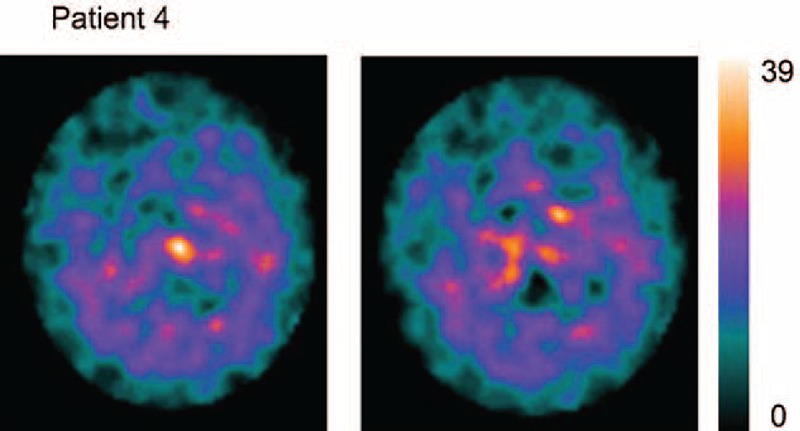
FIGURE 1.

FP/CIT SPECT acquisition in patient 4, who died during AC. SPECT is plotted at the maximum saturation level: notice residual activity in areas corresponding to caudate, and the widespread distribution of the ligand, appearing with low levels in extrastiatal areas. Notice that the saturation level of the scale is 1/4 of scales reported in Figure 3, and a 1/5 to 1/4 of Figure 1. Binding uptake shows the typical pattern “burst striatum,” a severe bilateral reduction with almost no uptake in either the putamen or caudate with increased background uptake.28,31. AC = akinetic crisis, SPECT = single-photon emission computerized tomography.
