
FIGURE 2.
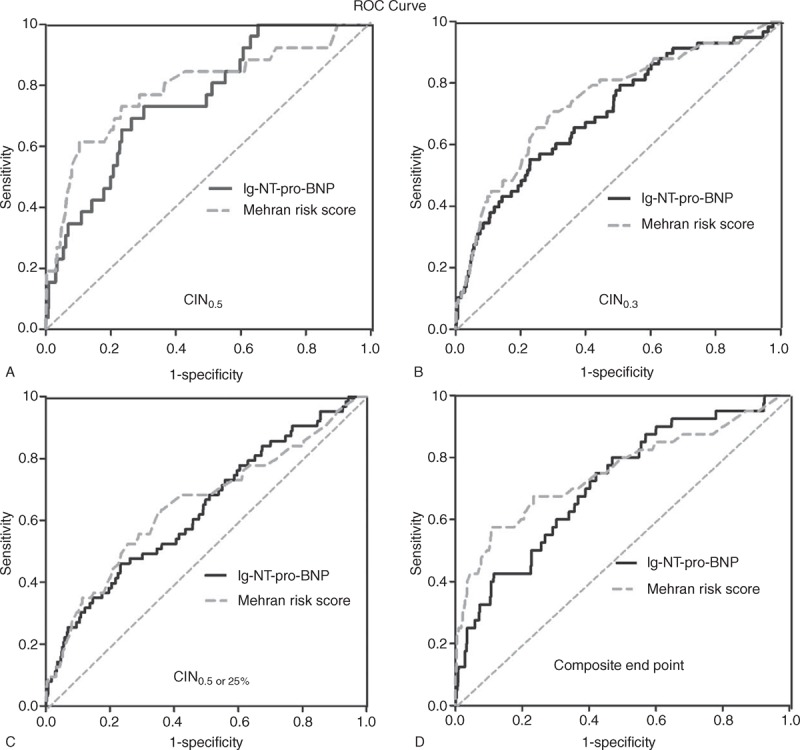
The ROC curve for NT-pro-BNP and Mehran risk score in order to predict (A) CIN0.5, (B) CIN0.3, or (C) CIN0.5 or 25% as well as (D) composite end point. CIN = contrast-induced nephropathy, NT-pro-BNP = N-terminal pro-B-type natriuretic peptide, ROC = receiver operating characteristic.