
FIGURE 1.
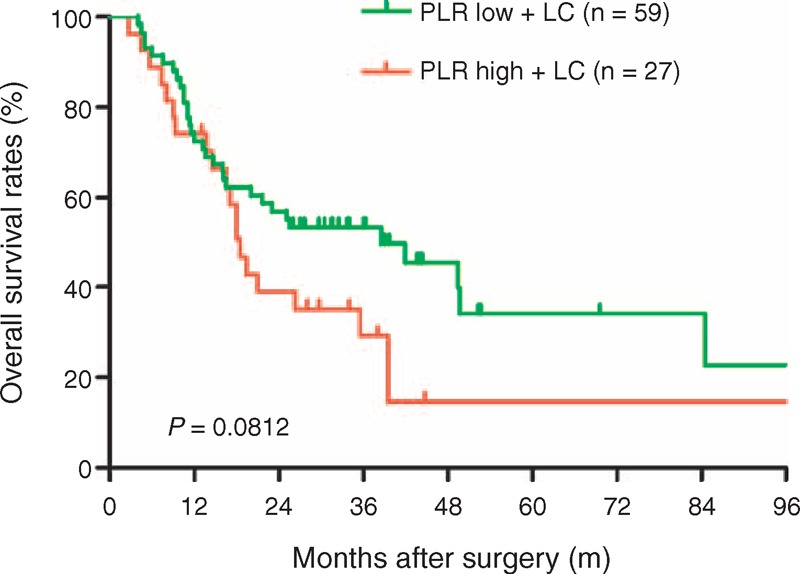
Comparison of overall survival rates in the PLR low + liver cirrhosis and PLR high + liver cirrhosis groups. The overall survival rate was no significant difference between PLR high + liver cirrhosis and PLR low + liver cirrhosis groups (P = 0.0812). LC = liver cirrhosis, PLR = platelet-to-lymphocyte ratio.