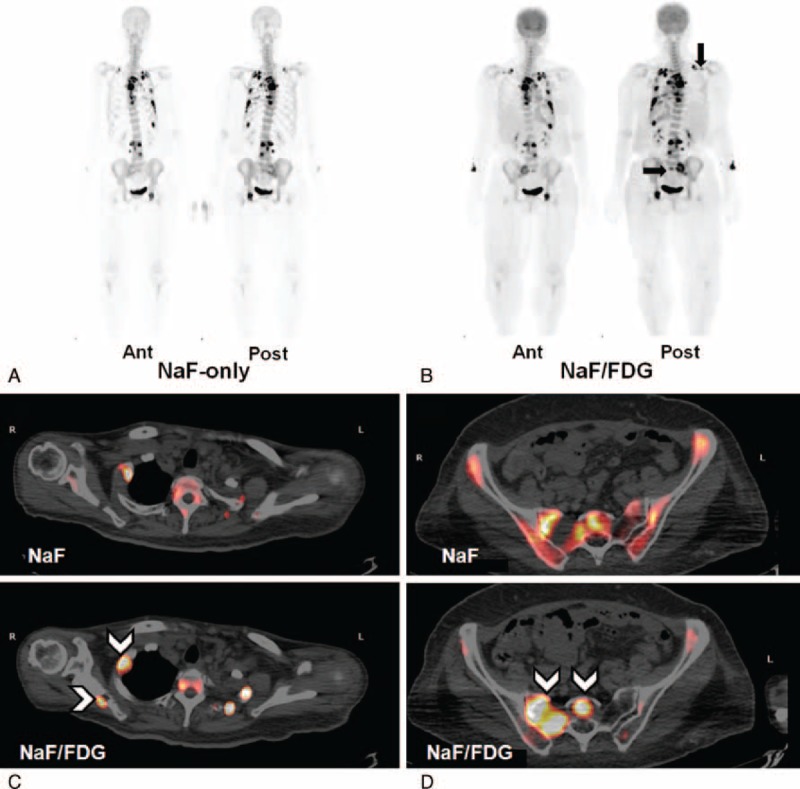
FIGURE 2.

(A) and (B) Maximum intensity projection of F-18 NaF PET/CT and F-18 NaF/FDG PET/CT at anterior and posterior views. The latter radiotracer reveals new foci in the right scapula and sacrum (black arrows), and more extensive uptake in lesions than the former. (C) and (D) Transaxial views of F-18 NaF/FDG PET/CT images show new foci in the right scapula and sacrum, and more extensive radiotracer uptake in the osteolytic portion of the 1st right rib and right sacroiliac region, compared to images using F-18 NaF only (arrow heads). FDG = fluorodeoxyglucose, NaF = sodium fluoride, PET/CT = positron emission tomography/computed tomography.
