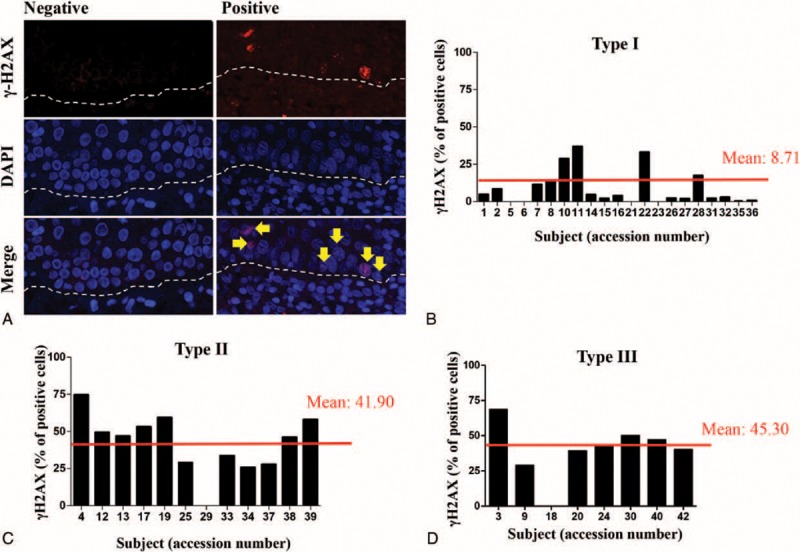
FIGURE 3.

Increased DNA damage correlates to poor response to therapy. (A) Representative examples of positive and negative OLP lesions for the γH2AX DNA double-strand break marker. Note the presence of γH2AX-positive cells next to the basal layer (arrow) of the oral mucosa (dashed line defines limit between connective and epithelial tissue). Quantification of γH2AX positive cells in (B) Type I OLP patients (mean value of 8.71% of positive cells), (C) Type II OLP patients (mean value of 41.90% positive cells), and (D) Type III OLP patients (mean value of 45.30% positive cells). OLP = oral lichen planus.
