
FIGURE 1.
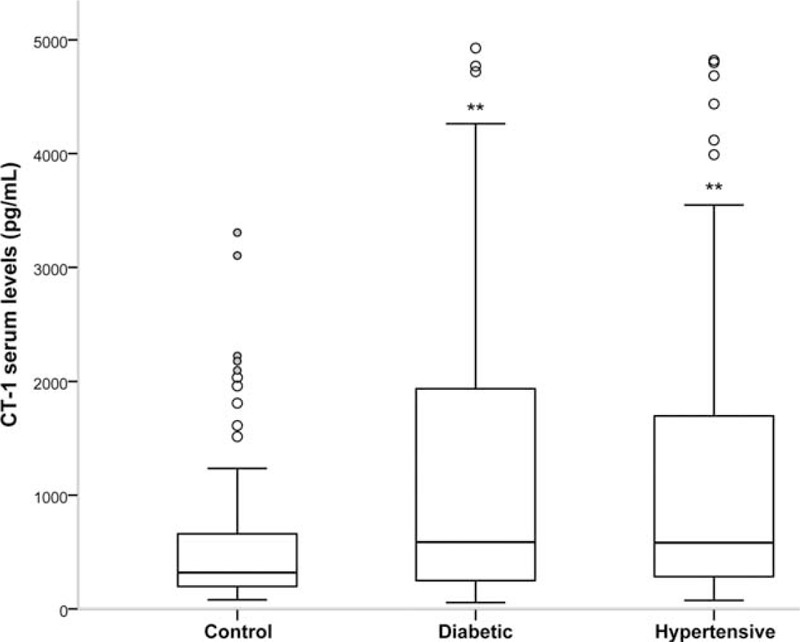
Cardiotrophin-1 (CT-1) plasma levels in DM (group of diabetic patients), HT (group of hypertensive patients), and Control (group of nondiabetic and nonhypertensive patients) groups. Statistically significant differences: ∗∗P < 0.01 versus Control group.