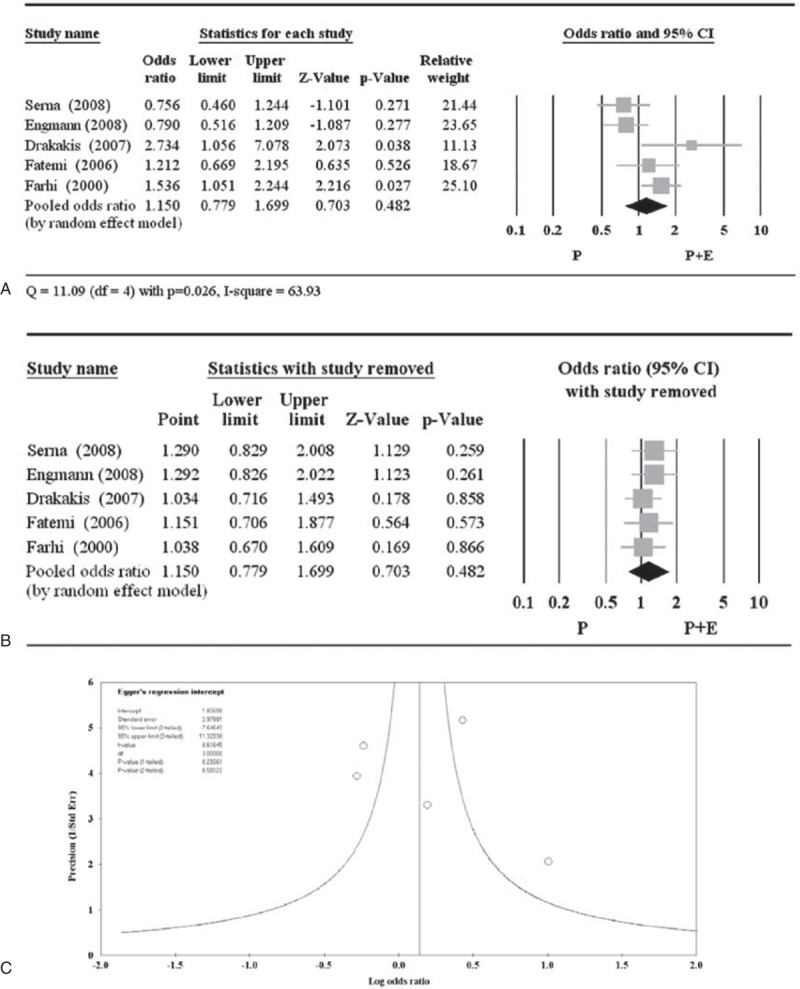
Figure 5.

Meta-analysis (A), sensitivity analysis (B), and funnel plot (C) for the odds ratio of implantation. The study by Var et al17 used a different definition of implantation rate and was excluded from the meta-analysis. CI = confidence interval.
