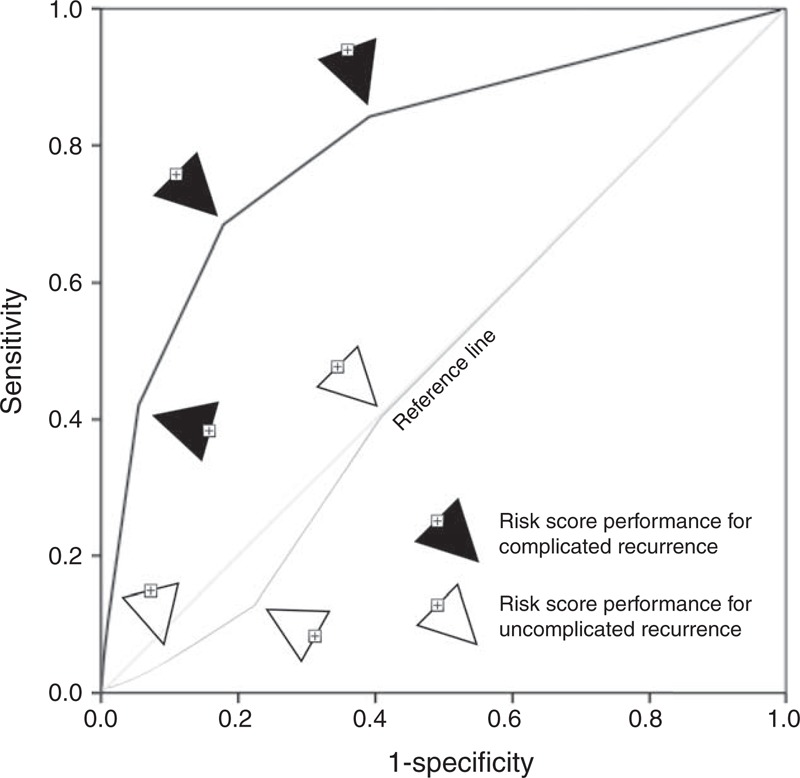
FIGURE 1.

ROC curves showing the predictive ability of the risk score. Notice that the risk score is poor predictor of uncomplicated recurrence (AUC 0.48, SE 0.03, 95% confidence interval 0.42–0.53, P = 0.42), but shows ability to predict complicated recurrence (AUC 0.80, SE 0.06, 95% confidence interval 0.69–0.92, P < 0.0001).
