FIGURE 2.

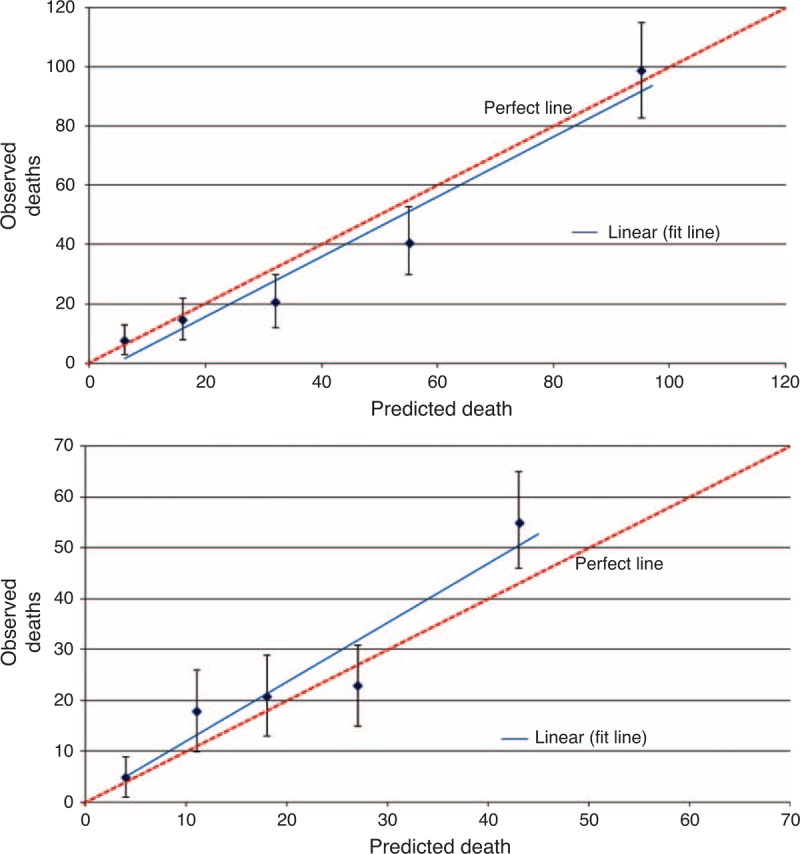
Calibration plot of observed mortality with 95% confidence interval against predicted mortality by quintiles of the predicted value, at (A) 5 and (B) 10 years after diagnosis.

Calibration plot of observed mortality with 95% confidence interval against predicted mortality by quintiles of the predicted value, at (A) 5 and (B) 10 years after diagnosis.