
FIGURE 1.
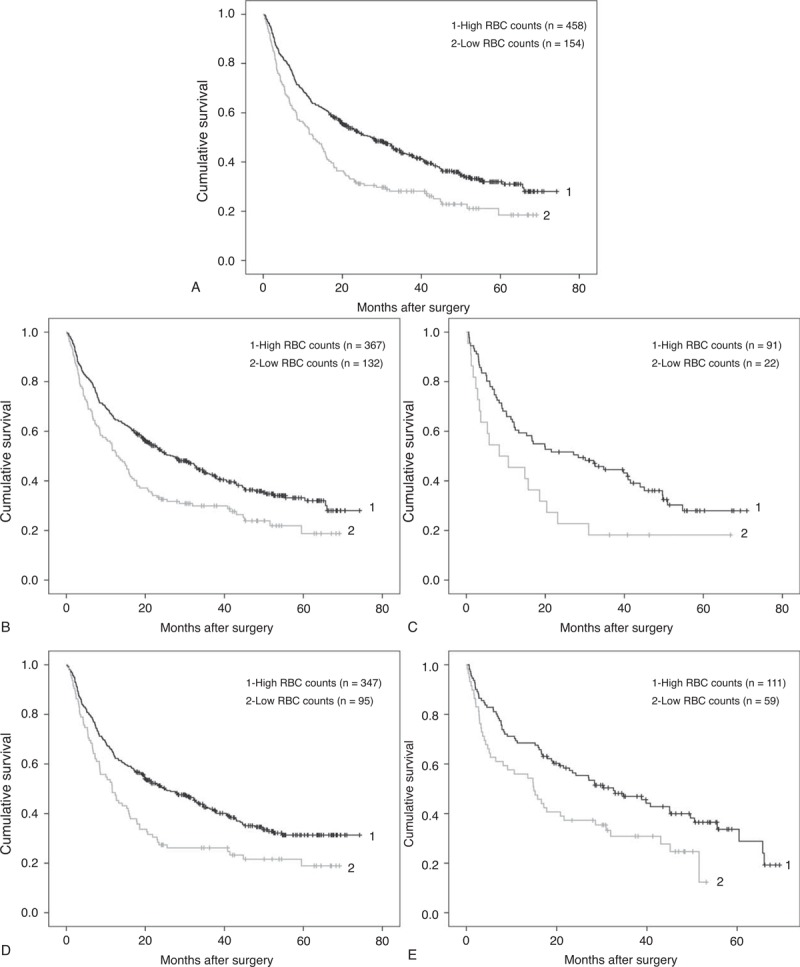
Comparison of overall survival between patients with high RBC counts and patients with low RBC counts. (A) Patients with high RBC counts (group 1, RBC ≥ 4 ×10¹²/L for male, ≥3.5 ×10¹²/L for female, n = 458) and patients with low RBC counts (group 2, RBC < 4 ×10¹²/L for male, <3.5 ×10¹²/L for female, n = 154). Log-rank test: P < 0.001. (B) Male patients with high RBC counts (group 1, n = 367) and patients with low RBC counts (group 2, n = 132). Log-rank test: P = 0.001. (C) Female patients with high RBC counts (group 1, n = 91) and patients with low RBC counts (group 2, n = 22). Log-rank test: P = 0.019. (D) Younger patients with high RBC counts (group 1, n = 347) and patients with low RBC counts (group 2, n = 95). Log-rank test: P = 0.001. (E) Older patients with high RBC counts (group 1, n = 111) and patients with low RBC counts (group 2, n = 59). Log-rank test: P = 0.010. RBC = red blood cell.