
FIGURE 6.
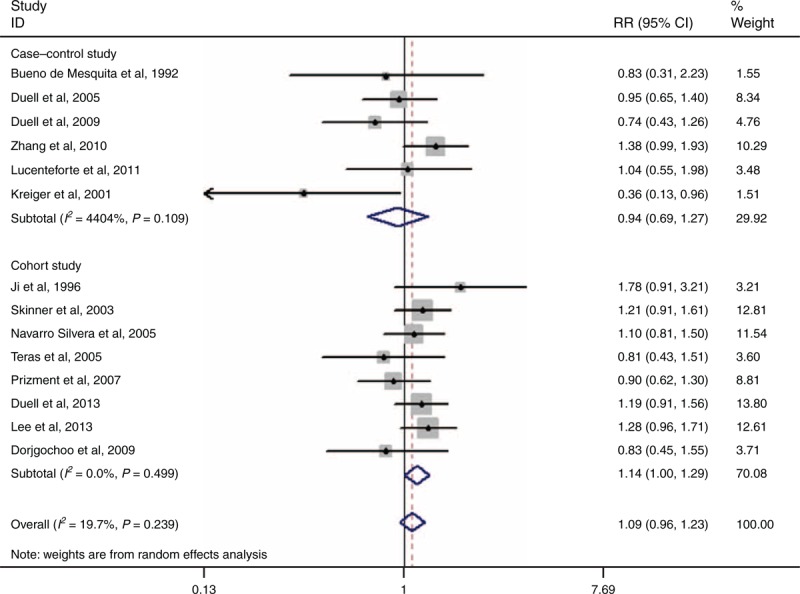
Forest plots of OC and PC risk. CI = confidence interval, RR = relative risk, OC = oral contraceptive, PC = pancreatic cancer.
Official websites use .gov
A
.gov website belongs to an official
government organization in the United States.
Secure .gov websites use HTTPS
A lock (
) or https:// means you've safely
connected to the .gov website. Share sensitive
information only on official, secure websites.
Forest plots of OC and PC risk. CI = confidence interval, RR = relative risk, OC = oral contraceptive, PC = pancreatic cancer.