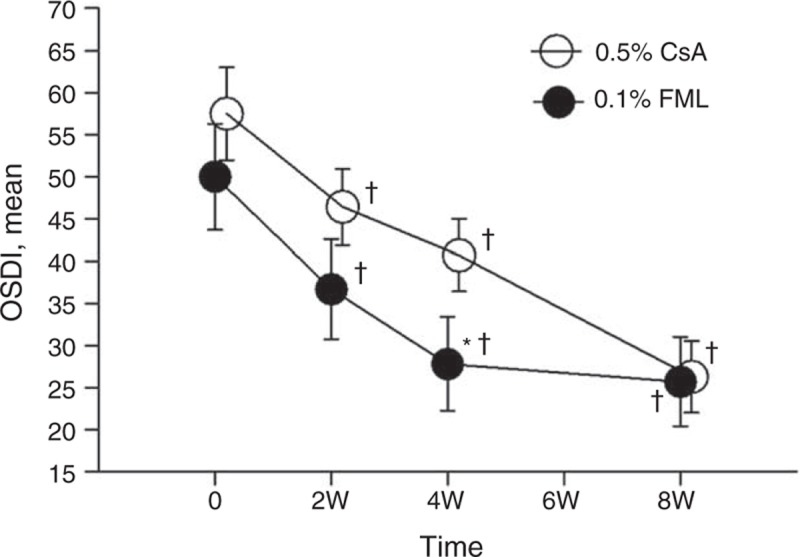
FIGURE 4.

The mean OSDI during 8 weeks follow-up. +Significantly different from the baseline value (FML group: P < 0.001 at weeks 2, 4, and 8; CsA group: P = 0.007 at week 2, P < 0.001 at weeks 4 and 8). ∗Significant intergroup difference (P = 0.042 at week 4). CsA = cyclosporine, FML = fluorometholone, OSDI = Ocular Surface Disease Index, W = week.
