
Figure 5.
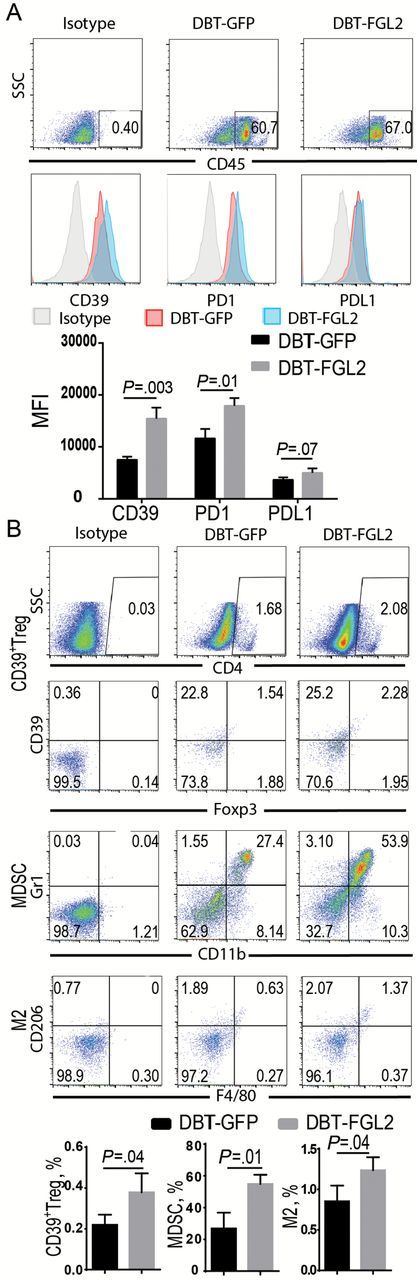
FGL2-augmented immunosuppression in the DBT tumor microenvironment. DBT-GFP and DBT-FGL2 glioma tissues in BALB/C mice were digested, and single-cell suspensions were collected for staining and analysis by fluorescence-activated cell sorting (FACS). A) CD39, PD-1, and PD-L1 expression levels in CD45+ cells were detected by FACS. The expression levels were presented as mean fluorescence intensity (MFI). Data were presented as the mean ± SD (n = 3). B) CD39+Tregs (CD4+CD39+Foxp3+), myeloid-derived suppressor cells (MDSCs, CD11b+Gr1+), and M2 macrophage (F4/80+CD206+) were detected by FACS. The levels of these cells were presented as the percentage of cells. Data were presented as the mean ± SD (n = 3) and analyzed by unpaired t test.