
Table 2.
Adjusted Means of PDFF of the Pancreas according to Group
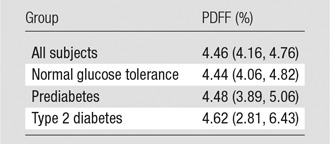
Note.—Data are mean PDFFs and were adjusted for age, sex, BMI, glycemic status, blood pressure, alcohol intake, smoking status, physical activity, ALT/AST ratio, lipase level, creatinine level, triglycerides level, and cholesterol-to-HDL ratio No significant differences between groups with different endocrine functional status of the pancreas (ie, glycemic status) were observed (Wald test, P = .980). Numbers in parentheses are 95% CIs.