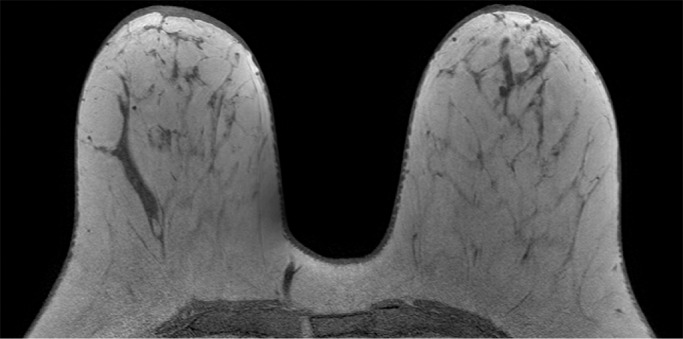
Figure 3a:

Examples of varying amounts of FGT on breast MR images, as assessed retrospectively, with observers blinded to known mammographic densities. Axial T1-weighted images show examples of breast composition described as (a) almost entirely fat, (b) scattered fibroglandular, (c) heterogeneous, and (d) extreme amount of FGT.
