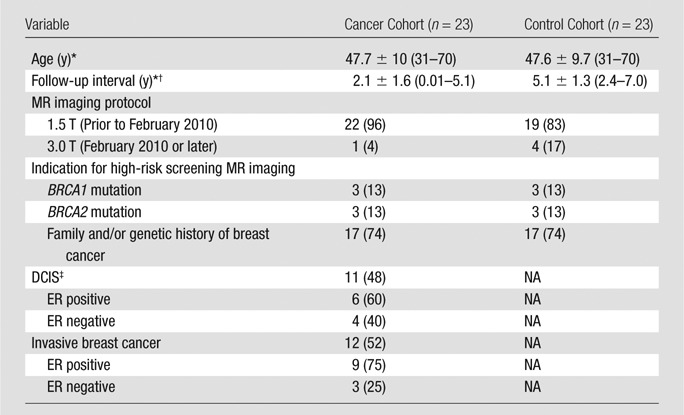
Table 1.
Patient Characteristics and Indications of the Cancer Cohort and Matched Negative Controls

Note.—Unless otherwise indicated, data are numbers of patients and data in parentheses are percentages. All patients were matched for age and BRCA mutation status. NA = not applicable.
* Data are mean ± standard deviation. Data in parentheses are the range.
† Data are time to diagnosis in the cancer cohort and follow-up time in control cohort.
‡ Data on ER status were unavailable for one patient with DCIS.
