
Table 2.
Comparison of Imaging Characteristics between the Cancer and Negative Control Cohorts by Conditional Logistic Regression
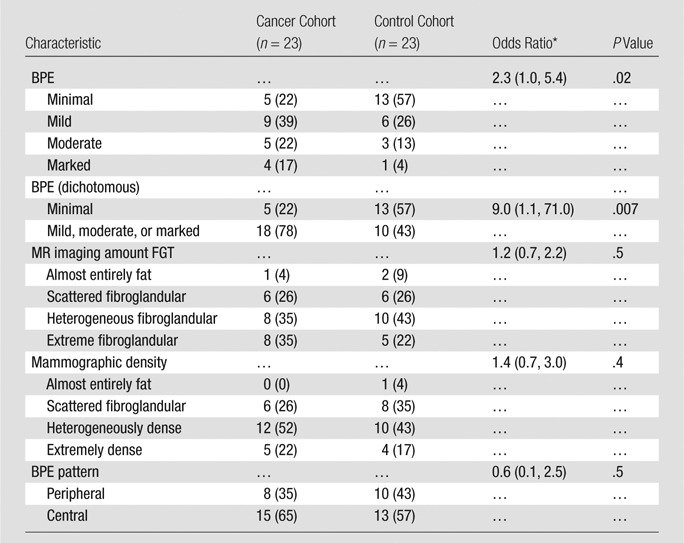
Note.—Unless otherwise indicated, data are numbers of subjects, with percentages in parentheses.
* Data in parentheses are 95% confidence intervals.