
Table 3.
Comparison of Imaging Characteristics between Patients Diagnosed with ER-positive and ER-negative Cancers at Logistic Regression
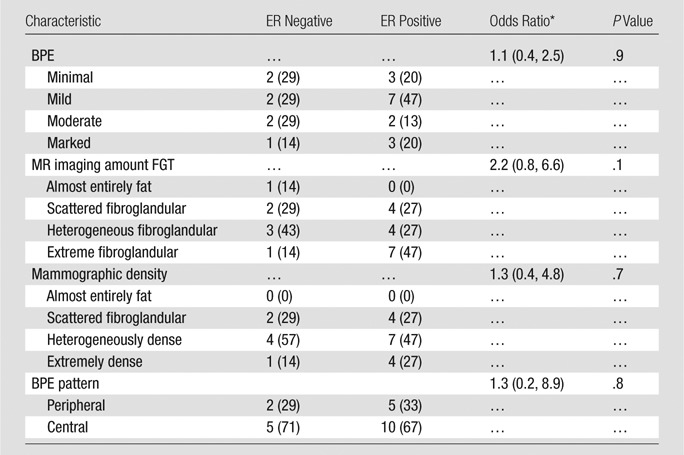
Note.—Unless otherwise indicated, data are numbers of subjects, with percentages in parentheses.
* Data in parentheses are 95% confidence intervals.