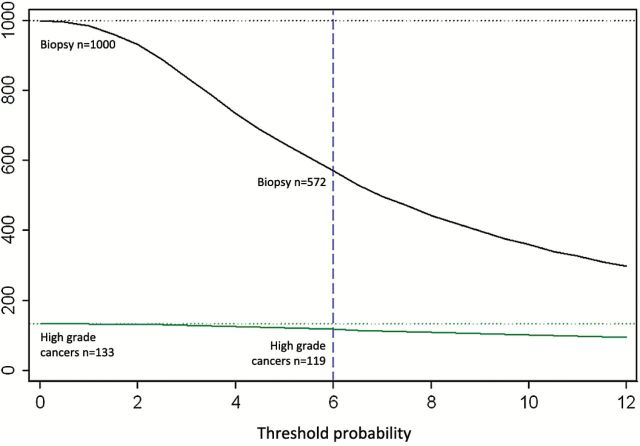
Figure 1.
Clinical implications of various biopsy strategies using a model developed to predict the risk of Gleason score 7 or higher (high-grade) prostate cancer based on four kallikrein markers measured in anticoagulated plasma collected from 4765 biopsied ProtecT participants. The graph illustrates the results of differing biopsy strategies per 1000 biopsied ProtecT-participants, with the x-axis denoting the risk of high-grade cancer and the y-axis indicating the number of men biopsied (black line) or detected with evidence of high-grade cancer (green line) using different biopsy strategies. The dotted vertical blue line illustrates a tentative cutpoint (6% risk of high-grade cancer) at which only 572 of 1000 of the men would be biopsied, which would result in the detection of 119 of 133 high-grade cancers.

